We went over a crude app that allocated and touched memory in a previous post. Allocations were done using int arrays, and touching the memory was done efficiently, only writing every 1024th element in each int array, which in turn would write each time to a subsequuent memory page (4KB in size, equivalent to 1024 x 4 bytes per int element) and force it into the working set. Yet the memory block size was fixed, the delay between allocations was hardcoded and all the allocated memory was eventually touched. It lacked control.
So what we’ll set out to do is write a new app that allocates (leaks) memory, that allows:
- Custom delay between subsequent allocations
- Adjustable size of the memory block allocated at once
- Memory block size specified in MB
- Variable touch “fill” ratio, specifying how much of the committed memory gets touched per each memory block allocated
- A threshold above which no more allocations will be performed, specified in MB (or 0 to allocate indefinitely)
- Command arguments to specify values for all the parameters described above
What we’ll get is a tool that can leak memory in a controlled fashion, with multiple “knobs” that can alter its behavior.
But there’s already testlimit for that I hear you saying. It’s a great tool but only runs under Windows. By contrast, writing our app in .NET Core (or simply .NET as it got rebranded) will ensure it’ll also run under Linux. On top of that, we’ll get to choose how much of the allocated memory will be touched. It might seem overkill for now, but it’ll come in handy later.
Inner workings
Internally, the app will allocate memory blocks of a specified size. It’ll do this by creating int arrays, whose individual overall size will be identical to the size of the block specified as input. Let’s visualize how the app will allocate memory in a simple scenario with 1 MB blocks and 1-second delay between allocations:

Note that in the diagram above we’re only allocating memory, and we’re never touching any of it. As a result, none of it will ever make it in the physical RAM, just as we discussed in this section on this blog previously.
To start using up RAM we’ll have to touch at least some part of those allocated blocks. How can we touch memory? Quite simple: after we allocate each block we’ll just write to it. And how much we write to it will dictate how much RAM will be used. And remember that one of the goals we’ve set out is to have variable touch fill ratio. Let’s consider the same scenario with 1 MB blocks and 1-second delay between allocations, but add extra a touch fill ratio of 1/4:
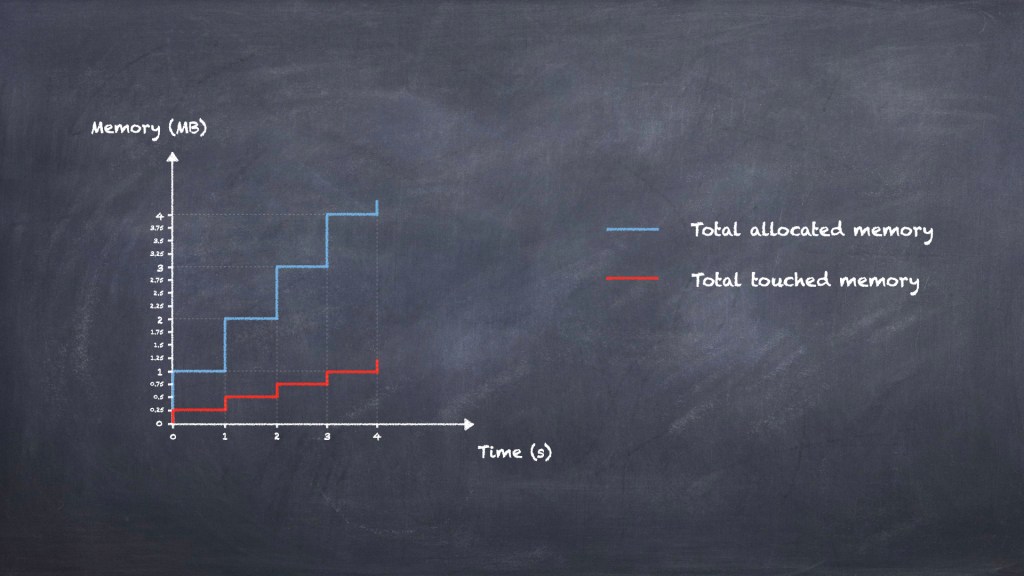
Every time a new memory block gets allocated, we touch 1/4 of it. The sum of allocated (or committed) memory will thus always be 4 times the sum of touched memory.
One can easily see that increasing the delay between allocations will result in a “stretched” pattern, with each stair “step” in the diagram being wider. Choosing a shorter delay will in turn “squash” things closer on the X-axis. On the other hand, a touch fill ratio of 1 will ensure that the sum of touched memory will closely track the sum of allocated memory – essentially we’ll touch all the memory we’re allocating. Contrast this with a touch fill ratio of 0, where none of the memory gets touched, which is essentially the scenario in figure 1.
To prevent the allocated arrays from being garbage-collected, we’ll use a List<int[]> to keep a reference to each of the arrays. This List object is kept alive right until the end of the code, so none of our allocations will “fall prey” to the GC.
Size of allocations
Note that the computations below are done for 64-bit, unless specified otherwise.
How do we make sure that the memory allocated – and optionally touched – is exactly the input value in MB that we specify? There are 2 components – the memory block that gets allocated each time, and the List<int[]> used to store the references to all those arrays.
We know precisely how much an int array takes:
- Its sync block index, type object pointer and size field each take up a number of bits equal to the pointer size, which comes down to 24 bytes for 64-bit
- 4 bytes per each element inside the
intarray
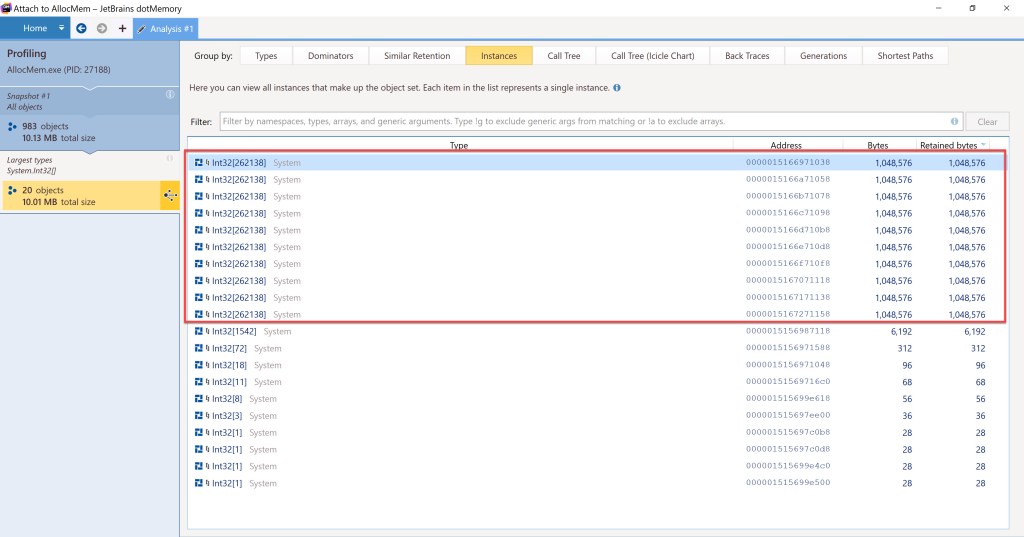
Allocating a precise amount of MB with each block is thus very simple. Just divide the desired size of the allocation (say, 1 MB) to the size of an int (4 bytes) and deduct 6 as to account for the overhead due to the array’s metadata (6 x4 = 24 bytes), and that gives the required number of elements in each array.
Let’s see how this will look like with 1 MB blocks when allocating 10 of them, from within dotMemory:
For the List<int[]>, we know how much that takes as well. There are 3 fields the structure declares internally:
- The const field
DefaultCapacityinsideList<int[]>is not kept with the object itself, but directly with the type. Hence we won’t have to consider it as taking space per eachList<int[]>block allocated _sizeand_versionfields each consume 4 bytes (each is anint) adding up to 8 bytes
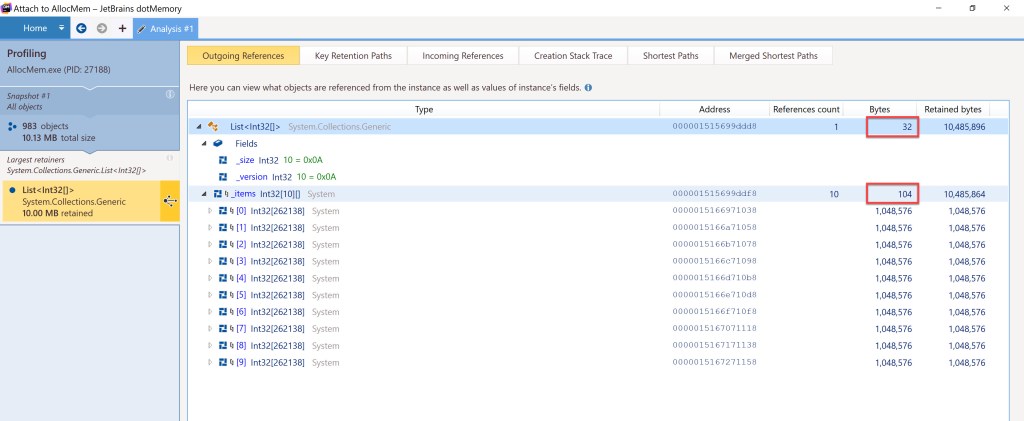
On top of that, there’s 2x pointer size for the List itself (own sync block index and type object pointer) plus 1x pointer size to hold the reference to the internal array. Overall this comes to 32 bytes for List<int[]> own metadata.
The List’s internal array will take n x pointer size bytes, where n is the number of memory blocks to be allocated, plus pointer size bytes for its size, plus 2x pointer size for its own sync block index and type object pointer. Keep in mind that dotMemory doesn’t include the space taken by the inner int[][] array in the “Bytes” field for the List<int[]>, but only what is uses directly. The internal array’s space is shown separately. Here are both values below for the 10x 1 MB block allocation considered:
Since all our int[] objects will be larger than 85,000 bytes (each of our int[] objects will consume at least 1 MB, since that’s the minimum value accepted as input by the tool) then they’ll be allocated on the Large Object Heap (LOH). This explains why we’ll see most of the memory usage there in dotMemory in the screenshots that will follow.
The computations above refer to what our code will explicitly allocate. Of course, there will be an overhead in the allocations due to the internals of .NET when running our code and because of what the process needs inside its own virtual address space (mapped files, assemblies loaded by .NET, etc).
The code
The work the code has to do is simple:
- Allocate a new memory block by creating a new
intarray - Touch the committed memory according to the fill ratio specified as input
- Store the reference to the new memory block as a new element inside our
List<int[]>, to prevent the GC from reclaiming the newly allocated array - Check if the committed memory target value has been reached, and if so exit the allocation loop
- Sleep for the duration specified and continue the loop
The tool will run until either it cannot allocate memory (if it’s not bounded by the input parameter), or until Ctrl+C is pressed (either during normal allocations, or after the specified memory size has committed and the code is just waiting).
Parameters the tool will support:
-m: size of individual memory blocks to allocate in MBs (default is 1)-e: time between allocations in ms. Since theSleepmethod is used, choosing low values (e.g. 7ms) won’t work as expected due to the internal timer used. Values above 30ms should work as expected-f: touch fill ratio, how much of the committed memory gets touched per each memory block allocated (default is 1)-x: stop allocating once memory committed reaches this value in MBs-b: break execution before allocation starts and wait for a key to be pressed. Useful to see initial overhead of the process
To avoid writing the logic to handle the parameters, we’ll use the CommandLineParser NuGet package, which will simplify things. A startup sample is provided already here, which we’ll use.
We’re not using any try/catch and simply rely on the fact that if memory can’t be allocated then that’s a critical enough error to terminate the process.
The code has been tested against .NET Core 3.1, .NET 5 and .NET 6 preview 7. The repo is on GitHub here.
In the next sections we’ll test that the code does what we expect of it, by running on Windows, Linux and inside containers. We’ll measure how much gets allocated and where. The common scenario will be to allocate 2 GB (2048 MB) in blocks of 100 MB but only touch a quarter of it (25% touch fill ratio).
Windows
The notions of committed memory and working set have been thoroughly explored back here on this blog. The main tool we’ll use will still be VMMap, just as it was when that article was written. The only change is that now we’re using .NET Core / .NET instead of .NET Framework.
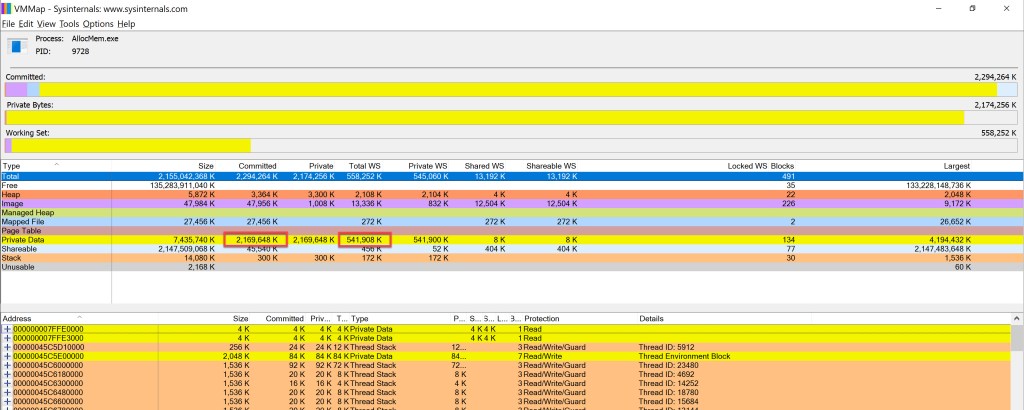
The committed memory will include – amongst others – all the blocks our tool will allocate. The working set will normally show how much of the memory our tool has touched. For both committed memory and working set it’s the “Private Data” section that we’ll want to watch out for.
Here’s the outcome of allocating 2 GB in 100 MB blocks and using a touch fill ratio of 0.25:
Here’s dotMemory used against the same application:
Note the output resembling figure 1, as dotMemory shows only the allocated memory, regardless of how much of it is touched.
Linux
Coming from the Windows world with the terms around memory management clearly laid out – say as a result of reading “Windows Internals” – you might run into problems when learning some of the equivalent terms in Linux. Take for example the term “working set”: in Windows this means the set of the pages inside the virtual address space of a process that are present in physical memory. But in Linux the same term means something different – as per this very good article: “how much memory an application needs to keep working“. The Linux’s “working set” is actually Windows’s “reference set”, the latter described here. As for Windows’s “working set”, the equivalent term in Linux is “resident set”.
Leaving aside such “false friends”, a lot of the notions around memory management will be similar, although the terms used to describe them (and the name of the backing structures in the OS) will be different. Take for example the segments the process address space is divided into, which in Linux are called Virtual Memory Areas (VMAs). The VMAs in Linux are the counterparts of the VADs (Virtual Address Descriptors) in Windows, which were briefly discussed back here.
Yet again other things will be identical in both Windows and Linux. Take memory pages, which in Linux are usually 4KB on either x86 or x64, just as in Windows. What this means is that our code doesn’t need to be modified in any way as opposed to how it’ll work on Windows – for every 1024 elements of an int[] array, accessing just one element will get the whole corresponding page in RAM in Linux as well.
What do we want to check? First, how much of the memory our code allocates is actually in the physical RAM. Secondly, how much memory gets allocated overall, or committed. To keep things simple for now, we’ll use a smaller scenario: allocate 200 MB in blocks of 1 MB and use a touch fill ratio of 25%.
Let’s first see RAM usage when our app touches the memory it allocated. There are several ways to go about it. We can use htop and check the RES field for the line matching our process:
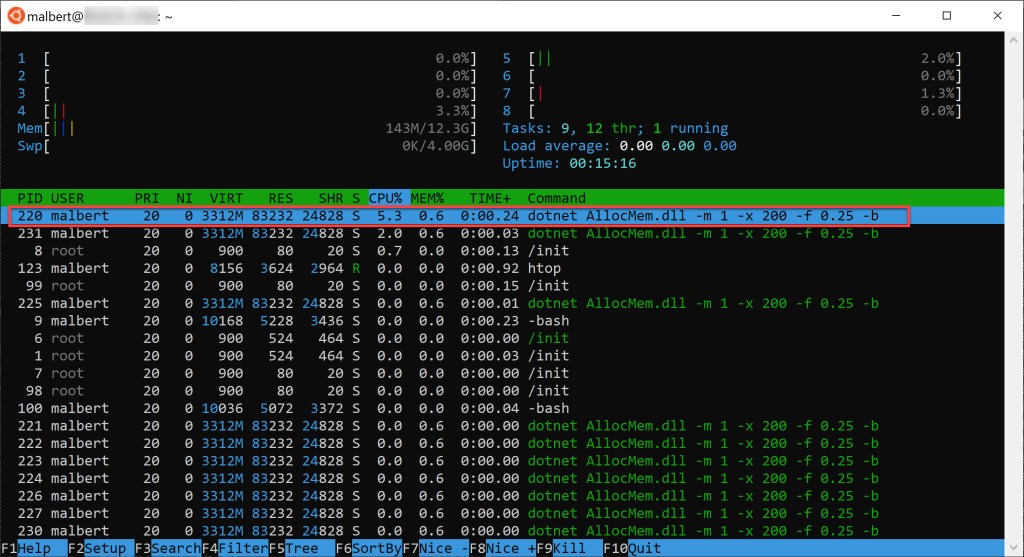
Note that the virtual address space size (the VIRT value) is not remarkably important for our purpose. There are quite a few segments of virtual memory allocated, but that doesn’t mean that all are backed by physical memory. Our leak memory tool shows up with ~3.3 GB of virtual memory when running, but most isn’t backed by physical memory at all, but instead consists of VMAs (virtual memory areas, or segments – also known as mappings) that have been created for the process address space. Similarly, remember that in figure 5 the total virtual address space size for the Windows process was ~2 TB, but that wasn’t any indication about how much memory the process actually allocated, nor how much of it was touched.
It’s the RES value that we care about, as that shows the amount of memory resident in physical RAM for that process (technically htop’s RES – which is the exact amount returned by ps v <id> – is less than the true RSS (Resident Set Size) because it doesn’t account for a few things but we’re talking a few KB).
Note that htop will show our process (white color) along with its threads (green color). You’ll notice that the threads have the same exact numbers reported as their parent. Why is this so? As per the “Linux Kernel Development” book: “threads are regular processes to the kernel that merely share certain resources“. So the memory values four our app shouldn’t be counted multiple times, as they refer to the same exact process address space.
But the value shown (~80 MB) is rather high and a bit far off from our 50 MB target (= 0.25 touch fill ratio* 200 MB overall to allocate). That’s because once our tool’s process starts, but before memory allocation starts, there’s already memory that’s in use (mapped files for the various .NET modules, internal objects the CLR needs, etc). Here’s a previous snapshot of htop for our scenario showing the initial state:
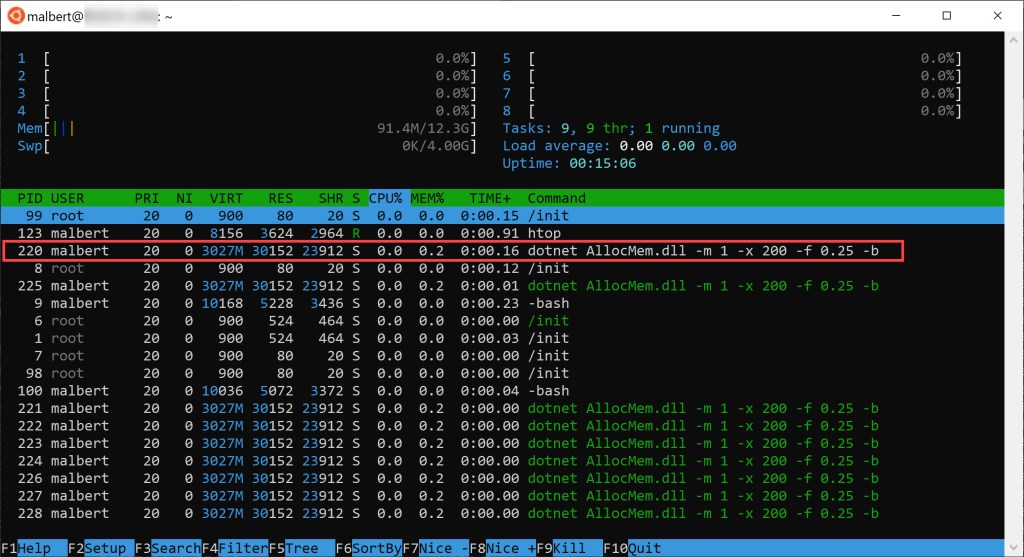
Deduct ~30 MB from 81 MB and you get very close to our 50 MB allocated; the rest is explainable most likely by the underlying OS or .NET internal allocations during our run.
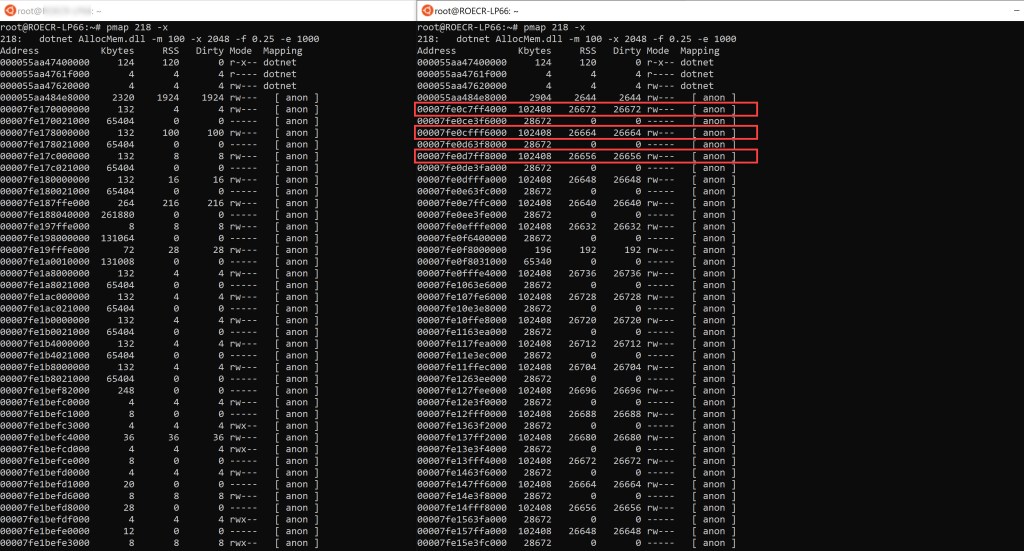
Another way to check how much RAM our tool consumes is to use pmap and check the segments in the VAS (virtual address space). If you’ve used VMMap under Windows, then you’ll see that pmap similarly shows the address space for a process. It’s easy to spot the VMAs we’re after if we’re touching a particular percent of the memory, as for each VMA we see both the full virtual size of the region as well as its RSS (resident set size). For example, here’s partial output for pmap showing the 2 regions that get allocated when using the tool to get 200 MB in blocks of 1 MB and touching just 25% of it (pmap’s values are all in KB):

How do we know these are the VMAs that hold our allocations? 3 reasons: first, their RSS (resident set size) is almost 25% of their size. Second, they’re part of the few new VMAs that showed up during our allocation; we know this since the left console shows the initial state of the process address space for the tool right before the allocations started. Third, “anon” in the pmap output refers to anonymous mapping, which in turn simply means the pages inside the respective segment aren’t used to map the contents of a file; the fact that their access is read/write (rw) is further proof that our allocations caused them.
Let’s do the same analysis for our initial scenario of allocating 2 GB in 100 MB blocks with a 25% fill ratio:
Same as before, the right console contains partial output of pmap showing some of the VMAs that get allocated by the tool. Only 3 are highlighted but note there’s quite a few (including further down in the non-captured printscreen). Similarly, they’re easy to identify since their RSS is roughly a quarter of their virtual size. It’s easy to see that the VMAs we’re interested in got allocated now by cross-checking with the address space ranges to the left console which captured the initial state of the app.
The VMAs’ size happens to coincide with what we’re requesting to be allocated per block (100 MB) but we’ve seen previously that this isn’t the norm back in figure 9. It’s at the OS discretion to choose the size of the VMAs.
How to check committed memory? Unlike in VMMap on Windows, where “committed memory” was laid out clearly for a process, I haven’t found a Linux utility that would display this. This might be related to the fact that Linux is using memory overcommit by default which complicates matters. Nonetheless, for our purpose we can look in the pmap output, and sum the sizes of the VMAs that are backed by anonymous pages with any type of protection other than none. As such, how much memory our allocation process has committed can be easily seen: for the 1 MB block, 200 MB max, 25% touch fill ratio – in the picture 9 summing the “KBytes” column for the VMAs highlighted gives almost exactly 200 MB. For the 100 MB blocks, 2 GB max, 25% touch fill ratio, the same “KBytes” column can be summed up in figure 10, whereby each region’s size is almost exactly 100 MB.
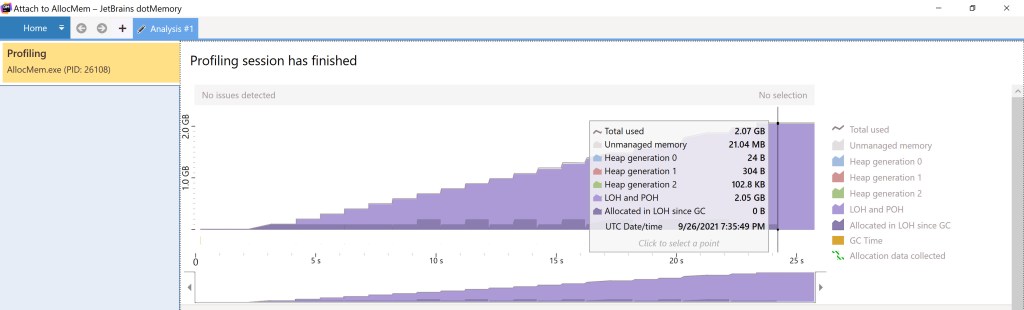
Another way to see the amount of committed memory is to use dotMemory. This will tell how much is seen allocated from the standpoint of .NET., as opposed to looking at the process user space’s VMAs with pmap as before whose sizes will have a slight overhead by comparison. Here’s the result of doing a snapshot after the allocation completed using dotMemory CLI inside Linux (./dotMemory get-snapshot <PID>), opened with dotMemory running on Windows:
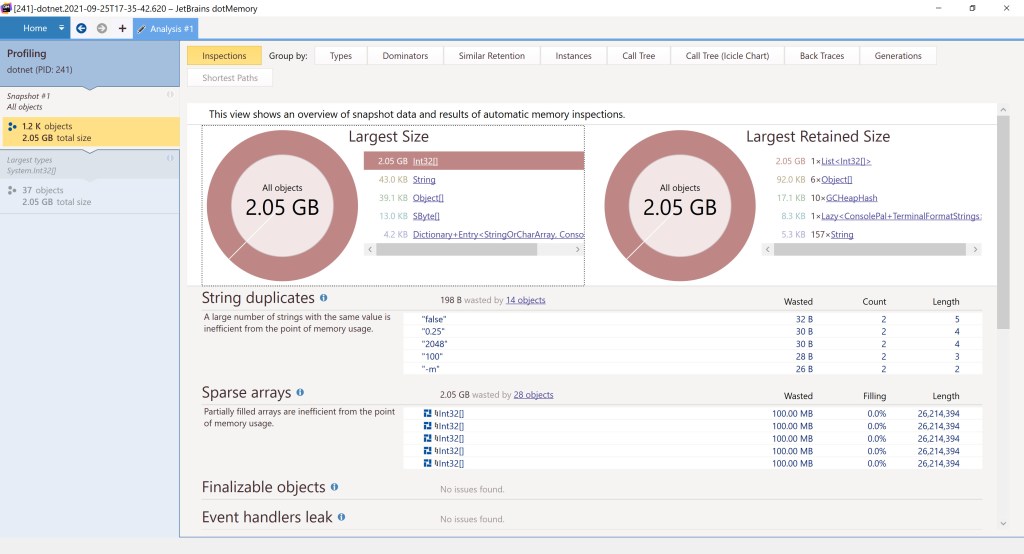
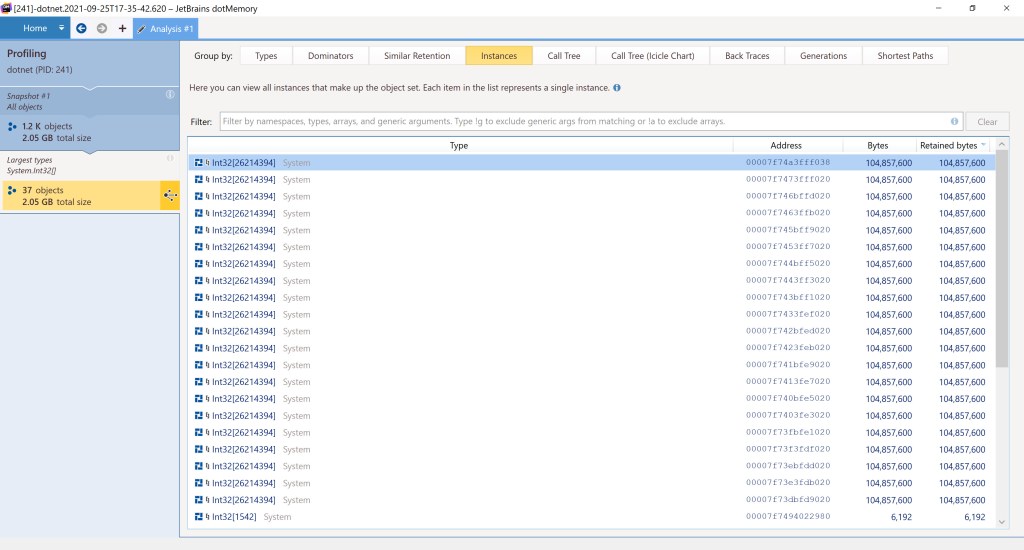
But why is there 2.05 GB in the space allocated for the int arrays? Didn’t we ask for exactly 2 GB (with -x 2048)? As long as the limit specified is non-zero (0 meaning allocate indefinitely) the code tries to allocate blocks so that they fill exactly the limit specified; should that fail however one more block will be allocated so that the limit specified is hit. In our scenario 20 blocks of 100 MB blocks can only fill 2000 MB out of the 2048 MB corresponding to 2 GB, so the code allocates one more block, driving the total to ~2.05 GB, equivalent to 21 blocks 100 MB each:
Note that – unlike what we got with pmap – this time there’s no information about how much of the allocated memory is actually present in RAM.
Also – yes, overall there were indeed 21 VMAs in the pmap output seen cropped back in figure 10, and with each of them almost exactly 100 MB, that gives 2100 MB in total.
Containers
Making the tool run inside a container is fairly simple. Microsoft has a straightforward procedure for containerizing a .NET app here. The Dockerfile we’ll use is almost identical to the one inside the article:
FROM mcr.microsoft.com/dotnet/runtime:5.0
COPY bin/Release/net5.0/ App/
WORKDIR /App
ENTRYPOINT [“dotnet”, “AllocMem.dll”]
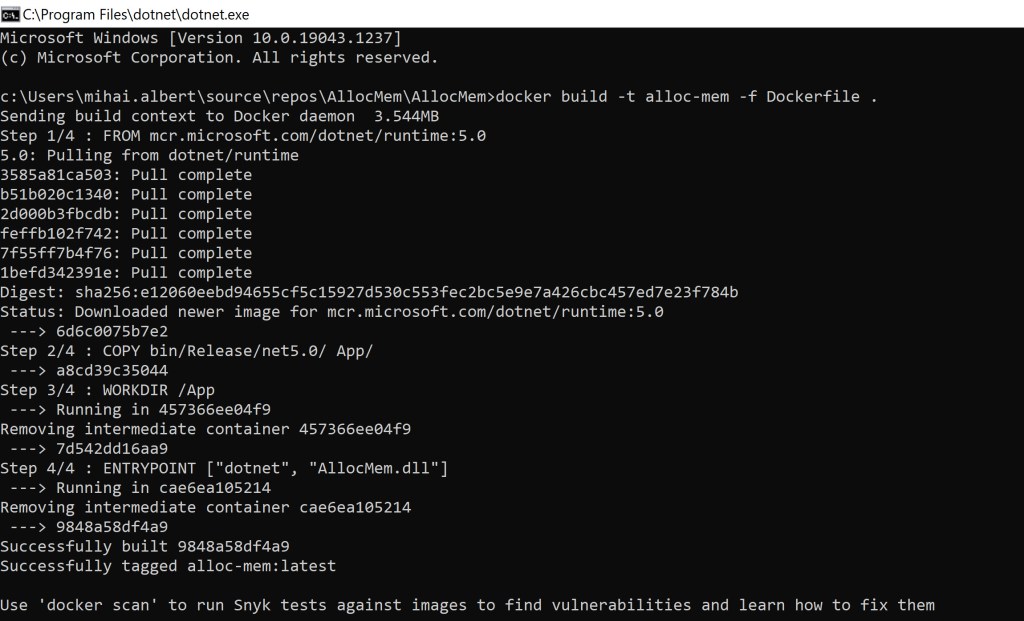
Note that we’re not using the SDK Docker image, as we have no need for it – we’ve used Visual Studio to build the tool. As such, we just need the image that contains the runtime, so the app will run when the resulting container is started. Next, we’ll build the image using as current directory the project’s folder:
C:\Users\mihai.albert\source\repos\AllocMem\AllocMem>docker build -t alloc-mem -f Dockerfile .
Firing up a container with our tool so it allocates 100 MB blocks with a target of 2048 MB, touches 25% of what it allocates, and pauses 1s between each subsequent block is as simple as issuing: docker run -it alloc-mem -m 100 -x 2048 -e 1000 -f 0.25
How to quickly check that the tool works as expected inside a container as well? Just use an interactive session to that container (docker exec -it <container_id> bash) to install htop (apt-get update + apt install htop on Ubuntu) and see it works as expected:
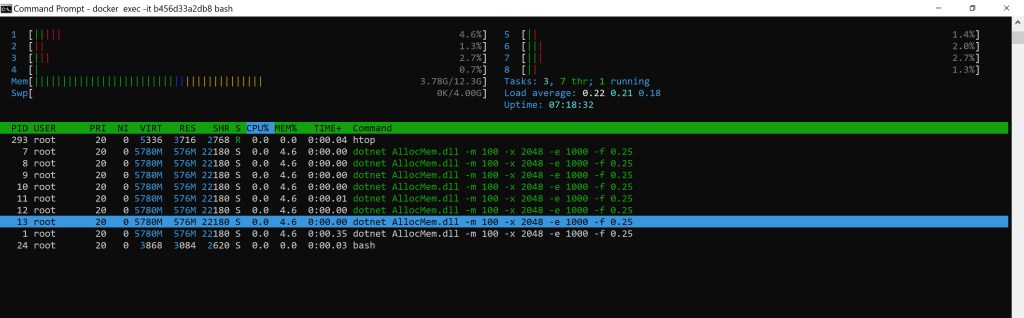
One obvious note: when our app ends (Ctrl+C pressed), the container stops as well. Thus any htop instance running using an interactive session – perhaps used to see how memory is consumed – will die immediately as well.
A word about our container’s shell
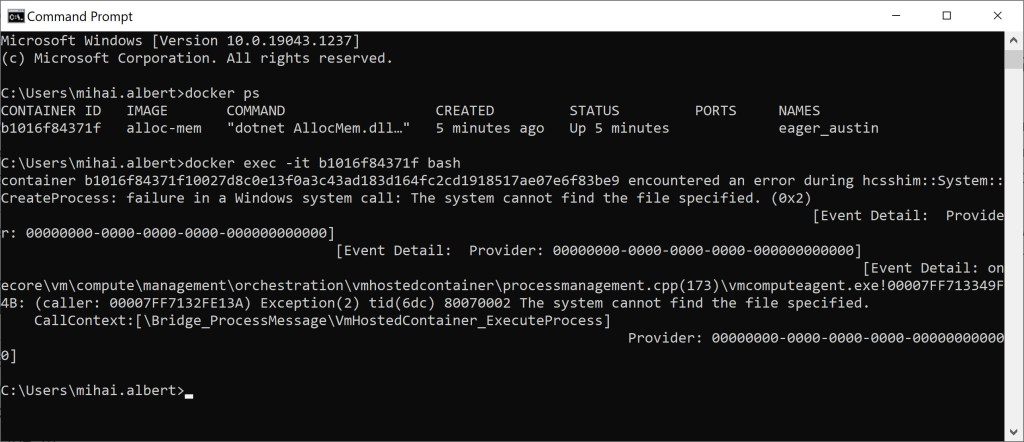
You might have noticed that in the precedent section we’ve used bash to connect to our container. That might sound strange, as after all, we’re on a Windows 10 machine with a container that runs a .NET application. Shouldn’t that shell be in this Microsoft-backed environment – OS (Windows 10) / container image (mcr.microsoft.com/dotnet/runtime:5.0) – the classic cmd? So why bash?
Moreover, if you use Docker on WSL2 trying to run the command below results in an error, despite the fact the image for that container was built on the same Windows 10 machine. The question would be why is it so?
C:\Users\mihai.albert>docker exec -it <container-id> cmdOCI runtime exec failed: exec failed: container_linux.go:380: starting container process caused: exec: “cmd”: executable file not found in $PATH: unknown
Running docker manifest inspect mcr.microsoft.com/dotnet/runtime:5.0 will list several architectures, meaning that the image is a multi-architecture image, supporting multiple OSes. When it gets pulled during our own image build – which build happens according to our Dockerfile – the most appropriate version based on the detected OS is chosen. As docker is running on WSL2 – which is using a full-fledged Linux VM to power it (the Kernel source is here – it’ll be a Linux OS that’s detected, and subsequently a Linux image will be pulled. If you look at the “Full Tag Listings” section at https://hub.docker.com/_/microsoft-dotnet-runtime?tab=description you’ll notice that for amd64 Linux the “5.0” tag is associated with a Debian 10 image (Update 09/26/2021: It appears the list of full tag descriptions got removed in the last days, so the type of image is no longer visible; only the bulk list of tags remain by following a link Update 10/06/2021: The list of full tag descriptions is back). Hence cmd won’t be available as a shell, as that will only be found in one of the Windows variants inside the multi-arch image. Instead, bash will be present, as that’s included in that Debian 10 image that gets pulled. How do we know it’s the Debian 10 image that actually gets pulled when requesting mcr.microsoft.com/dotnet/runtime:5.0? We can simply check the OS version by execing into a container built on top of that image:
C:\Users\mihai.albert>docker exec -it 6e5a8d8a1e87 bashroot@6e5a8d8a1e87:/App# cat /etc/os-release
PRETTY_NAME=”Debian GNU/Linux 10 (buster)”
NAME=”Debian GNU/Linux”
VERSION_ID=”10″VERSION=”10 (buster)”
VERSION_CODENAME=buster
ID=debian
HOME_URL=”https://www.debian.org/”
SUPPORT_URL=”https://www.debian.org/support”
BUG_REPORT_URL=”https://bugs.debian.org/”
How about if we build our Docker image using another dotnet runtime container image? Here’s the output when using the tag 5.0.2-alpine3.12 inside our Dockerfile and subsequently running a container based off that image:
C:\Users\mihai.albert>docker exec -it fa86244ea05c cat /etc/os-release
NAME=”Alpine Linux”
ID=alpine
VERSION_ID=3.12.3
PRETTY_NAME=”Alpine Linux v3.12″
HOME_URL=”https://alpinelinux.org/”
BUG_REPORT_URL=”https://bugs.alpinelinux.org/”
We can’t directly invoke bash, as the trimmed-down Alpine version doesn’t have it, but showing the file content directly confirms the Linux distro in use.
Windows containers
So we’ve seen why we can’t invoke the Windows cmd shell in our previously built Docker images, simply because we’re building Linux Docker images using a full-fledged Linux VM, and then run the resulting containers as Linux containers. So how could we get our tool to run inside a Windows container?
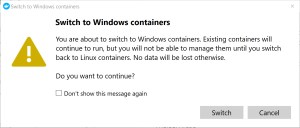
From the tray icon for Docker use the “Switch to Windows containers” menu. You’ll be prompted with the warning below:
Once you switch (there are some prerequisites needed before you do), let’s build our Docker image again. The output looks similar to how it would when a Linux one gets built:
But once a container based on our recently built image is started, trying to run bash inside will fail:
Since it’s a Windows image that got pulled from the multiarch one when our Docker image was built, and because there’s no bash process that can be launched, the error above is returned. How about running cmd – will that work?
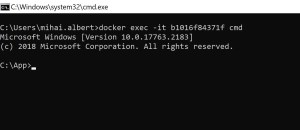
This time we’re able to successfully invoke cmd.
Known issues
On Ubuntu 20.04 LTS running on WSL2, using the tool to allocate with a touch fill ratio of 0 will incorrectly result in all the allocated memory touched. Other Linux versions tested (Debian 9 on WSL2, SLES 12 on WSL2, Ubuntu 16.04 (non-WSL)) don’t exhibit this problem. There’s a thread here opened about this.
Q&A
Q: Why not use ArrayList to allocate the memory, as it could do it in larger chunks due to all the boxed objects?
A: The time to allocate is too long for any significant quantity of memory, due to all the garbage collection that gets triggered as the result of each value being boxed.
Q: If I run the tool on my machine, the size of the working set is eventually less than all the touched memory. Why is this so?
A: As the RAM gets crowded, the OS swaps pages to the pagination file, freeing memory. As our app only touches one sequence of bytes at a time (roughly 4 bytes, corresponding to an int element, if we ignore the overhead per each List<int> “block” allocated), the OS can safely take out the data previously touched that the code isn’t actively using anymore. This is unlike containers, where usually apps don’t have to fight each other for memory.
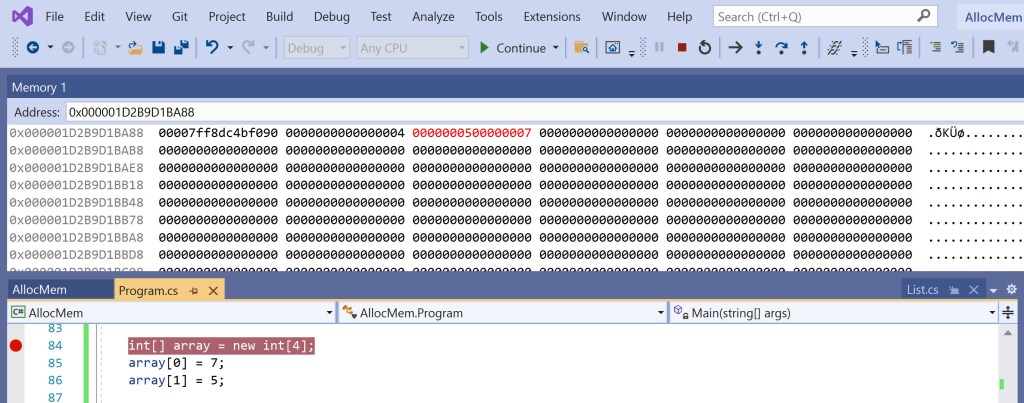
Q: Are you sure the size of an int array is equal to the pointer size?
A: Yes, have a look at the picture below showing code built for 64-bit. You see the elements of the array so far (5 and 7) in the 64-bit value highlighted in red. The previous 64-bit value – the same one that comes after the type object pointer – contains the length of the array (4) and nothing else.
Q: How much space does a constant int field inside a class consume for multiple instances of that class?
A: The value of that field will be used directly in the instructions that will use it, so there’s no space taken inside each instance as per https://stackoverflow.com/questions/23529592/how-are-c-sharp-const-members-allocated-in-memory. Consequently, the DefaultCapacity constant field inside the List<int[]> type won’t take up any space for any of its instances
Q: What’s the difference between options, arguments and commands supplied on a command line?
A: See this https://docs.microsoft.com/en-us/archive/msdn-magazine/2019/march/net-parse-the-command-line-with-system-commandline
Q: I’m getting Error: /proc must be mounted while trying to run vmstat. What’s wrong?
A: If you’re running Linux under WSL2, check the version of the distro you’re running (wsl -l -v) and if it’s 1 then upgrade to 2 using wsl --set-version <distro-name> 2. This should take care of the problem, and vmstat will run afterwards
Q: I’m trying to use pmap to see the address space of a process, but all I get in the output is a single line showing the command line used to invoke that process, without any information about the address space. What’s wrong?
A: pmap needs to be run either as the user that launched the process being “peeked into” or as root to show the virtual address space
Q: Couldn’t the tool just read from those int arrays to touch the memory?
A: No, because that would trigger Linux to use only the “zero page” https://lwn.net/Articles/517465/ and essentially not have the desired memory touched. In Windows however, that would work just fine, as it will actually provide a zeroed page from the zero page list, thus bring it into its working set.
Q: I can’t get .NET SDK 6 to work. What do I need to do?
A: If .NET 6 is still in preview when you read this, see the steps in this article https://dotnetcoretutorials.com/2021/03/13/getting-setup-with-net-6-preview/
Q: How do I install dotMemory CLI on Linux?
A: Download the .tar.gz file from here https://www.jetbrains.com/dotmemory/download/#section=commandline, then run mkdir -p "dotMemory" && tar zxf JetBrains.dotMemory.Console.linux-x64.2021.2.1.tar.gz -C "dotMemory"
Q: Despite setting a value for the delay interval of n seconds in the tool, I see blocks being allocated far more slowly sometimes. Why is that?
A: If the host you’re running on is low on memory and a large fill ratio (close to 1) is used, then allocating will take far longer than the -e parameter specifies, as the host OS tries to swap out memory and make room for the memory blocks that our app requests.
Q: Are there any prerequisites from switching from Linux containers on Docker to Windows ones?
A: Yes, you’ll need the features below:
Q: I’m capturing data using dotMemory on Window, but I don’t get a “stair” pattern like in figure 6 back in the Windows section. What’s wrong?
A: dotMemory has its own heuristic that interpolates the ETL allocation data collected. As such, sometimes it incorrectly smooths out the edges. I’ve opened an issue here https://dotnettools-support.jetbrains.com/hc/en-us/requests/3509900. How did I get that stair-like pattern back in figure 6? I’ve simply noticed that when GC runs often, dotMemory is more prone to leave the chart resembling a stair; so I’ve used one instance of the allocation tool to fill up the physical RAM and then started another instance which was used as input to dotMemory.
