This is part 3 of a four-part article that looks into what happens in detail when Kubernetes runs into out-of-memory (OOM) situations and how it responds to them. You can find the article’s full table of contents here as part of the first post.
Metrics components
There are several components that generate and consume metrics for a Kubernetes cluster. In this section, we’ll go over some of those components that can provide useful memory metrics for us, see what they do and how they interconnect, look at the endpoints they expose, and the format data is provided in. We’ll briefly discuss some Prometheus components now, even if they’re not builtin inside Kubernetes, as we’ll make use of them further into the article. Grafana and Prometheus will be treated in depth separately in their own section later on.
There is as of now (Dec 2021) overlapping functionality between some of the components we’ll go over, since some are slated for decommissioning. Note also that things are moving fast in the Kubernetes land, so by the time you read this some of the items presented might have already changed.
Keep in mind that we’ll not discuss “grand” topics such as types of monitoring pipelines (for which you can find a starter here) nor the Kubernetes monitoring architecture (which is discussed in a proposal document – although dated by now – here). Nor will we touch upon components that don’t have a direct bearing on the problem we’re trying to solve, such as the Custom Metrics API. We’ll stick to the point and only do detours when strictly required.
But why are we talking about the actual components that will gather metrics? Why not just jump straight to the memory metrics we’re after? As this post will go on to analyze various scenarios around memory usage in a Kubernetes cluster, it’s paramount that we can measure accurately what those memory values are. We’ll see that there are several tools we can use to obtain those values, and depending on which tool we use there are specific components involved that return different metrics and have respective “rates” of producing them.
Components
The components involved are below. A quick description is followed by some important info for each:
- Summary API: A Kubelet API which currently exposes node metrics for use by both system components and monitoring systems (source). The exact reason for its planned deprecation – the fact that it handles 2 types of metrics and collects an inadequate volume for both – is expanded on here. As to when exactly it’ll be deprecated, it doesn’t appear to happen any time soon
- Resource Metrics API: Allows consumers to access resource metrics (CPU and memory) for pods and nodes. It’s briefly presented here. This API’s “incarnation” is usually the Metrics Server. Note that the Resource Metrics API is due to replace the Summary API
- Metrics Server: A cluster-wide aggregator of resource usage data. It’s presented briefly here, although the article is slightly confusing at this time* (as it refers to the “Metrics API”, but the scope discussed makes so it cannot be the Custom Metrics API, therefore it has to be the Resource Metrics API). The Metrics Server is the implementation of the Resource Metrics API as stated here, while the Metrics APIs – which includes the Resource Metrics API, and which are used by various clients (e.g.
kubectl top) to talk to the aforementioned implementation – are just “blueprints” and are defined and live in a separate repo here https://github.com/kubernetes/metrics. Note that alternative implementations of the Resource Metrics API exist, such as the Prometheus Adapter, described here which can be deployed in place of the Metrics Server. A good design document about the Metrics Server is here, although it’s a bit dated; note that the Summary API referenced there is scheduled for decommissioning eventually as stated in this GitHub issue. The Metrics Server runs as a single pod by default inside thekube-systemnamespace - Kubelet: The daemon that runs on every Kubernetes node and controls pod and container lifecycle, among many other things. Source here
- cAdvisor: An open source container monitoring solution that only monitors containers, and has no concept of Kubernetes constructs like pods or volumes. Source here. It’s worth noting that cAdvisor is capable of reporting node metrics as well, as explained in How come cAdvisor’s own endpoint doesn’t return any node data, but the Resource Metrics endpoint (that queries cAdvisor in turn) does?
- kube-state-metrics (KSM): Generates metrics from Kubernetes API objects without modification (source). If the whole Prometheus stack is deployed, the kube-state-metrics agent runs as a single pod named
prometheus-kube-state-metricsinside the namespace where Prometheus is deployed. Keep in mind that the goal of kube-state-metrics is not to show resource usage, but the state of the Kubernetes cluster, as detailed here. Also note that no Kubelet endpoint is used to pull its data, as the kube-state-metrics service watches for Kubernetes events to build its “mental image” as described here - Prometheus node exporter: It exposes hardware and OS metrics of *NIX kernels, as described in the repo’s home page. We’ll use it to monitor the AKS nodes in our setup, which are running Linux. Note that the node exporter has to be deployed separately (AKS doesn’t deploy it automatically, but the Prometheus stack does contain it). There’s also a Windows exporter, but that won’t be in our scope
Endpoints
Let’s now take a look at the endpoints the metrics components presented above expose. We’ll briefly present each and include a sample of the metrics data returned.
For our purposes, we’ll be going over 3 categories: the endpoints exposed by Kubelet, the Prometheus node exporter endpoint, and the Kubernetes cluster-level ones. Keep in mind that we’ll only list the relevant endpoints for extracting metrics e.g. don’t expect /healthz, /pods or /metrics/probes etc to be listed as Kubelet endpoints, as they don’t give direct information about this.
Kubelet endpoints:
| Endpoint | Description | Format | Sample |
|---|---|---|---|
/stats/container/stats/<podname>/<containername>/stats/<namespace>/<podname>/<poduid>/<containername> | cAdvisor v1 ContainerInfo json metrics endpoint on Kubelet (source). Deprecated, and no longer exists in recent versions of K8s | JSON | N/A |
/spec | cAdvisor v1 MachineInfo json metrics endpoint on Kubelet (source). Deprecated, and no longer enabled by default in recent versions of K8s | JSON | N/A |
/stats/summary | Summary API endpoint on Kubelet (source). Planned on being deprecated in the future. Format: JSON | JSON | here |
/metrics/resource | Resource Metrics endpoint on Kubelet, returns core metrics in Prometheus format (source). Additional info here. Note that this is exposed by the Kubelet, and used by the Metrics Server as the target to query the Kubelet itself. Keep in mind that the Resource Metrics API is not implemented by the Kubelet, and its implementation – the Metrics Server (or alternatively the Prometheus Adapter) – targets the /metrics/resource endpoint on each Kubelet to gather data, as described here | Text | here |
/metrics/cadvisor | cAdvisor endpoint on Kubelet | Text | here |
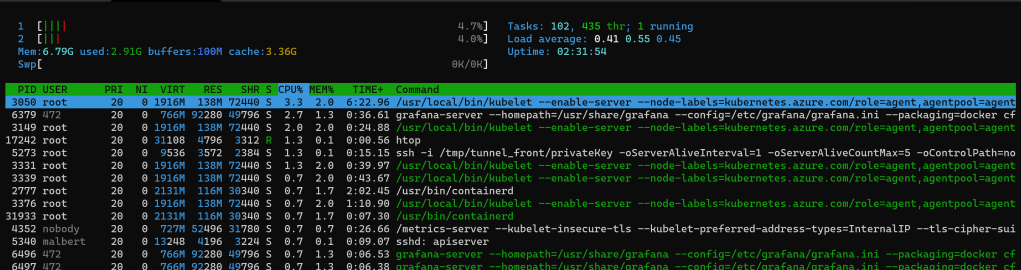
/metrics | Kubelet endpoint that exposes Kubelet’s own metrics (source). The container information it has is limited to only their name and status, there’s no memory usage for them. The only memory metrics are for the Kubelet process itself (which check out using htop, if you want to try). Do not confuse with the /metrics kube-state-metrics endpoint defined at the Kubernetes API Server level | Text | here |
Prometheus node exporter:
| Endpoint | Description | Format | Sample |
|---|---|---|---|
/metrics | Prometheus node exporter endpoint, running on each Linux node of the cluster; reachable by default over port 9100. Do not confuse with the Kubelet endpoint /metrics which is exposed on the Kubelet’s default port 10250 | Text | here |
Cluster-level endpoints:
| Endpoint | Description | Format | Sample |
|---|---|---|---|
/api/v1/namespaces/<namespace>/services/prometheus-kube-state-metrics:8080/proxy/metrics | kube-state-metrics endpoint defined at the Kubernetes API Server level, as described here. Do not confuse with the /metrics Kubelet endpoint | Text | here |
/apis/metrics.k8s.io/v1beta1/nodes/apis/metrics.k8s.io/v1beta1/namespaces/<name>/pods/<name> | Resource Metrics API endpoints defined at the Kubernetes API Server level and pointing to the Metrics Server | Text | here |
Metrics components diagram
After discussing all the metrics components and their endpoints, let’s see how they all come together. The main purpose is to easily see what sources of metrics the tools we’ll be using to collect our data are relying on. This will allow us not to expect identical values for 2 different tools relying on different metrics sources.
Note that this diagram is primarily built for the infrastructure scenario we’re analyzing in this article, namely a fairly recent AKS cluster – meaning containerd as the container runtime – along with a Prometheus deployment. Other Kubernetes implementations that don’t use containerd might have components linked slightly differently.

Specific colors are used for the blocks, as follows: Kubernetes’ own metrics components or metrics components endpoints are shown in yellow, external tools (e.g. Prometheus, Grafana) are blue, container runtime is red and the Kubernetes API Server is green.
The endpoint URLs shown are what a regular user would use to connect there directly (for example using a browser as it will be discussed later in Browser, with kubectl proxying directly to the API server), not what the components use between themselves (as they won’t connect to /.../proxy/....). This makes it easy to quickly copy an endpoint path from the diagram and see what your Kubernetes cluster returns for it. Back when we discussed the endpoints the URL paths presented there were as “local” as possible: the Kubelet endpoints are shown as you’d reach them from the respective node, while the cluster-level endpoints had their Kubernetes API Server URL path.
A couple of points worth noting:
- The diagram only shows one generic node instance, with its corresponding Kubelet. Therefore the “Kubernetes Node” block will be duplicated a number of times equal to how many nodes there are in the cluster. All the components drawn outside of that “Kubernetes Node” block will have a single instance*. So if there are 5 nodes in your Kubernetes cluster there will be 5 “Kubernetes Node” blocks, with the components not part of the “Kubernetes Node” block showing up once but still connecting to each of those 5 instance
kubectl get --rawcan be used as a “tool” against every metric component or endpoint displayed, but as to not make the diagram too complicated it’s not shown- The Prometheus server has a target defined for the Kubernetes API server that targets only its
/metricsendpoint, hence the reason for it being stamped on the respective connector on the diagram - The Kubernetes API Server is proxying the connections to several other components (e.g. Metrics Server) but this isn’t shown on the diagram to keep things simple
- The diagram assumes that Metrics Server has been deployed, as the implementation of the Resource Metrics API. The reason is that the Metrics Server is deployed automatically with a new AKS cluster ever since version 1.10 and the test cluster used in this article is an AKS one. However, alternate solutions such as the Prometheus Adapter are possible
- Not all the targets scraped by Prometheus are shown, but only those are linked to the topic of memory metrics that we’re interested in
- You see the container runtime being talked to directly, but that actually happens via CRI. A good article that shows how runc, container runtimes, CRI, and Kubernetes come together is here: The differences between Docker, containerd, CRI-O and runc
- The bug referenced on the dotted line to the CRI is CRI stats are overwritten by cAdvisor ones for Summary API. The stats are actually retrieved from the container runtime, the problem is that they’re overwritten by the cAdvisor ones
Metrics collection rate
How often is metric data collected by the various endpoints we’ve seen? For some of the components below you’ll see “N/A” next to them, meaning I don’t have an answer right now. Yet, as most of the components eventually chain to cAdvisor, it makes sense that they can’t have a metric refresh rate higher than their source.
- Summary API endpoint on Kubelet: N/A
- Resource Metrics endpoint on Kubelet: I don’t have any data to back this up, but a random test showed the oldest timestamp to be 17s as opposed to the current time when the page was loaded
- cAdvisor endpoint on Kubelet (
/metrics/cadvisor): The/metrics/cadvisorrefreshes its data every 10s (source). A simple test that can be performed: refresh the page pretty often and keep in mind that the timestamp is the last value for each metric row and it’s in Linux timestamp format (in milliseconds, so discard the last 3 digits). Doing a random test shows that the oldest timestamp is 18s as opposed to the retrieval moment in a rendered page response /metricsendpoint on Kubelet: N/A- kube-state-metrics: N/A
- Metrics Server: As per its official repo https://github.com/kubernetes-sigs/metrics-server “fast autoscaling, collecting metrics every 15 seconds.” We know it’s relying on the Resource Metrics endpoint, which we’ve seen above approximately matches this value
- Prometheus node exporter: N/A
Tools for viewing metrics
There are certain tools and Kubernetes commands we’ll be using throughout this article. For some of them, this section will only briefly introduce them, as they’ll be expanded upon later on. For others – such as Prometheus – they’ll be discussed in more detail now, as what comes afterwards will have to build on this knowledge.
Grafana
If you do a regular install for Prometheus and Grafana on a Kubernetes cluster with the kube-prometheus-stack Helm chart you’ll get a few charts out of the box inside Grafana that are of interest from the standpoint of memory used:
- Kubernetes / Compute Resources / Pod
- Kubernetes / Compute Resources / Node (Pods)
- Kubernetes / Compute Resources / Workload
If you look inside the definition of those charts you’ll see the following metrics used:
- Kubernetes / Compute Resources / Pod:
- “Memory Usage (WSS)” row: uses
container_memory_working_set_bytes - “Memory Quota” row:
- “Memory Usage (WSS)”: uses
container_memory_working_set_bytes - “Memory Requests”: uses
cluster:namespace:pod_memory:active:kube_pod_container_resource_requests - “Memory Requests %”: divides the “Memory Usage (WSS) value by “Memory Requests”
- “Memory Requests”: uses
cluster:namespace:pod_memory:active:kube_pod_container_resource_limits - “Memory Limits %”: divides the “Memory Usage (WSS) value by “Memory Limits”
- “Memory usage (RSS)”: uses
container_memory_rss - “Memory usage (Cache)”: uses
container_memory_cache - “Memory usage (Swap)”: uses
container_memory_swap
- “Memory Usage (WSS)”: uses
- “Memory Usage (WSS)” row: uses
- Kubernetes / Compute Resources / Node (Pods):
- “Memory Usage” row:
container_memory_working_set_bytes - “Memory Quota” row: the same identical metrics as for the Pod chart above
- “Memory Usage” row:
- Kubernetes / Compute Resources / Workload:
- “Memory Usage” row:
container_memory_working_set_bytes - “Memory Quota” row: a subset of the metrics as for the Pod chart above
- “Memory Usage” row:
What do all these metrics represent? We’ll see that in detail further down the article (the Metrics values section deals with this). For now, let’s just see how those metrics are obtained. As our article relies on the scenario whereby Prometheus is used as the source for metric data, we’ll discuss this one next.
Prometheus
As per its official overview page, Prometheus “collects and stores its metrics as time series data, i.e. metrics information is stored with the timestamp at which it was recorded, alongside optional key-value pairs called labels“. Prometheus’ purpose in our test setup is to gather data from various metrics components, store it and make it available to Grafana so that the latter can display it on its dashboards.
But why would we need Prometheus as an additional component that gathers metrics data, particularly since we’ve seen that there’s quite a few Metrics components that already generate this data? For example, the Summary API endpoint already generates a wealth of memory metrics data, so why not just plot those directly in Grafana? Here are a few reasons:
- The values returned by some of the metrics components (e.g. by the Resource Metrics API or Summary API) are only instantaneous. You won’t be able to see those values plotted on a chart as there’s only the last value emitted
- Prometheus queries (or “scrapes”) multiple metrics components, so that it acts as a “hub” where various metrics are stored, which are then made available to Grafana to show on its dashboards. Grafana needs only to define one data source for Prometheus to get all the metrics
- cAdvisor – which is currently built in the Kubelet – can’t get the node level stats, but instead just emits the root cgroup stats that account for all processes (not just containers, as seen in the cgroups section previously). Prometheus node exporters, which are installed separately on the underlying Kubernetes nodes, are required for “true” node metrics: first, because the values might be wrong by looking just at the cgroup root level (e.g. cAdvisor’s
container_memory_cachefor the root cgroup will show higher values than the node exporter’snode_memory_Cache_bytes, while the chart form suggests some sort of double-accounting; my experiments showed the difference sometimes being higher than 1 GiB) and secondly because many of the per-node memory OS metrics just aren’t exported by cAdvisor (e.g. there’s noinactive_file,active_file,SReclaimable, etc reported by cAdvisor as node metrics). Prometheus then scrapes these node exporters to get the node-level stats.
Out-of-the-box, Prometheus configures a set of sources to query for data. These sources are in Prometheus language “targets”, and the process of retrieving data from them is called “scraping”. Below you can see a partial view of the targets configuration from our Prometheus setup:
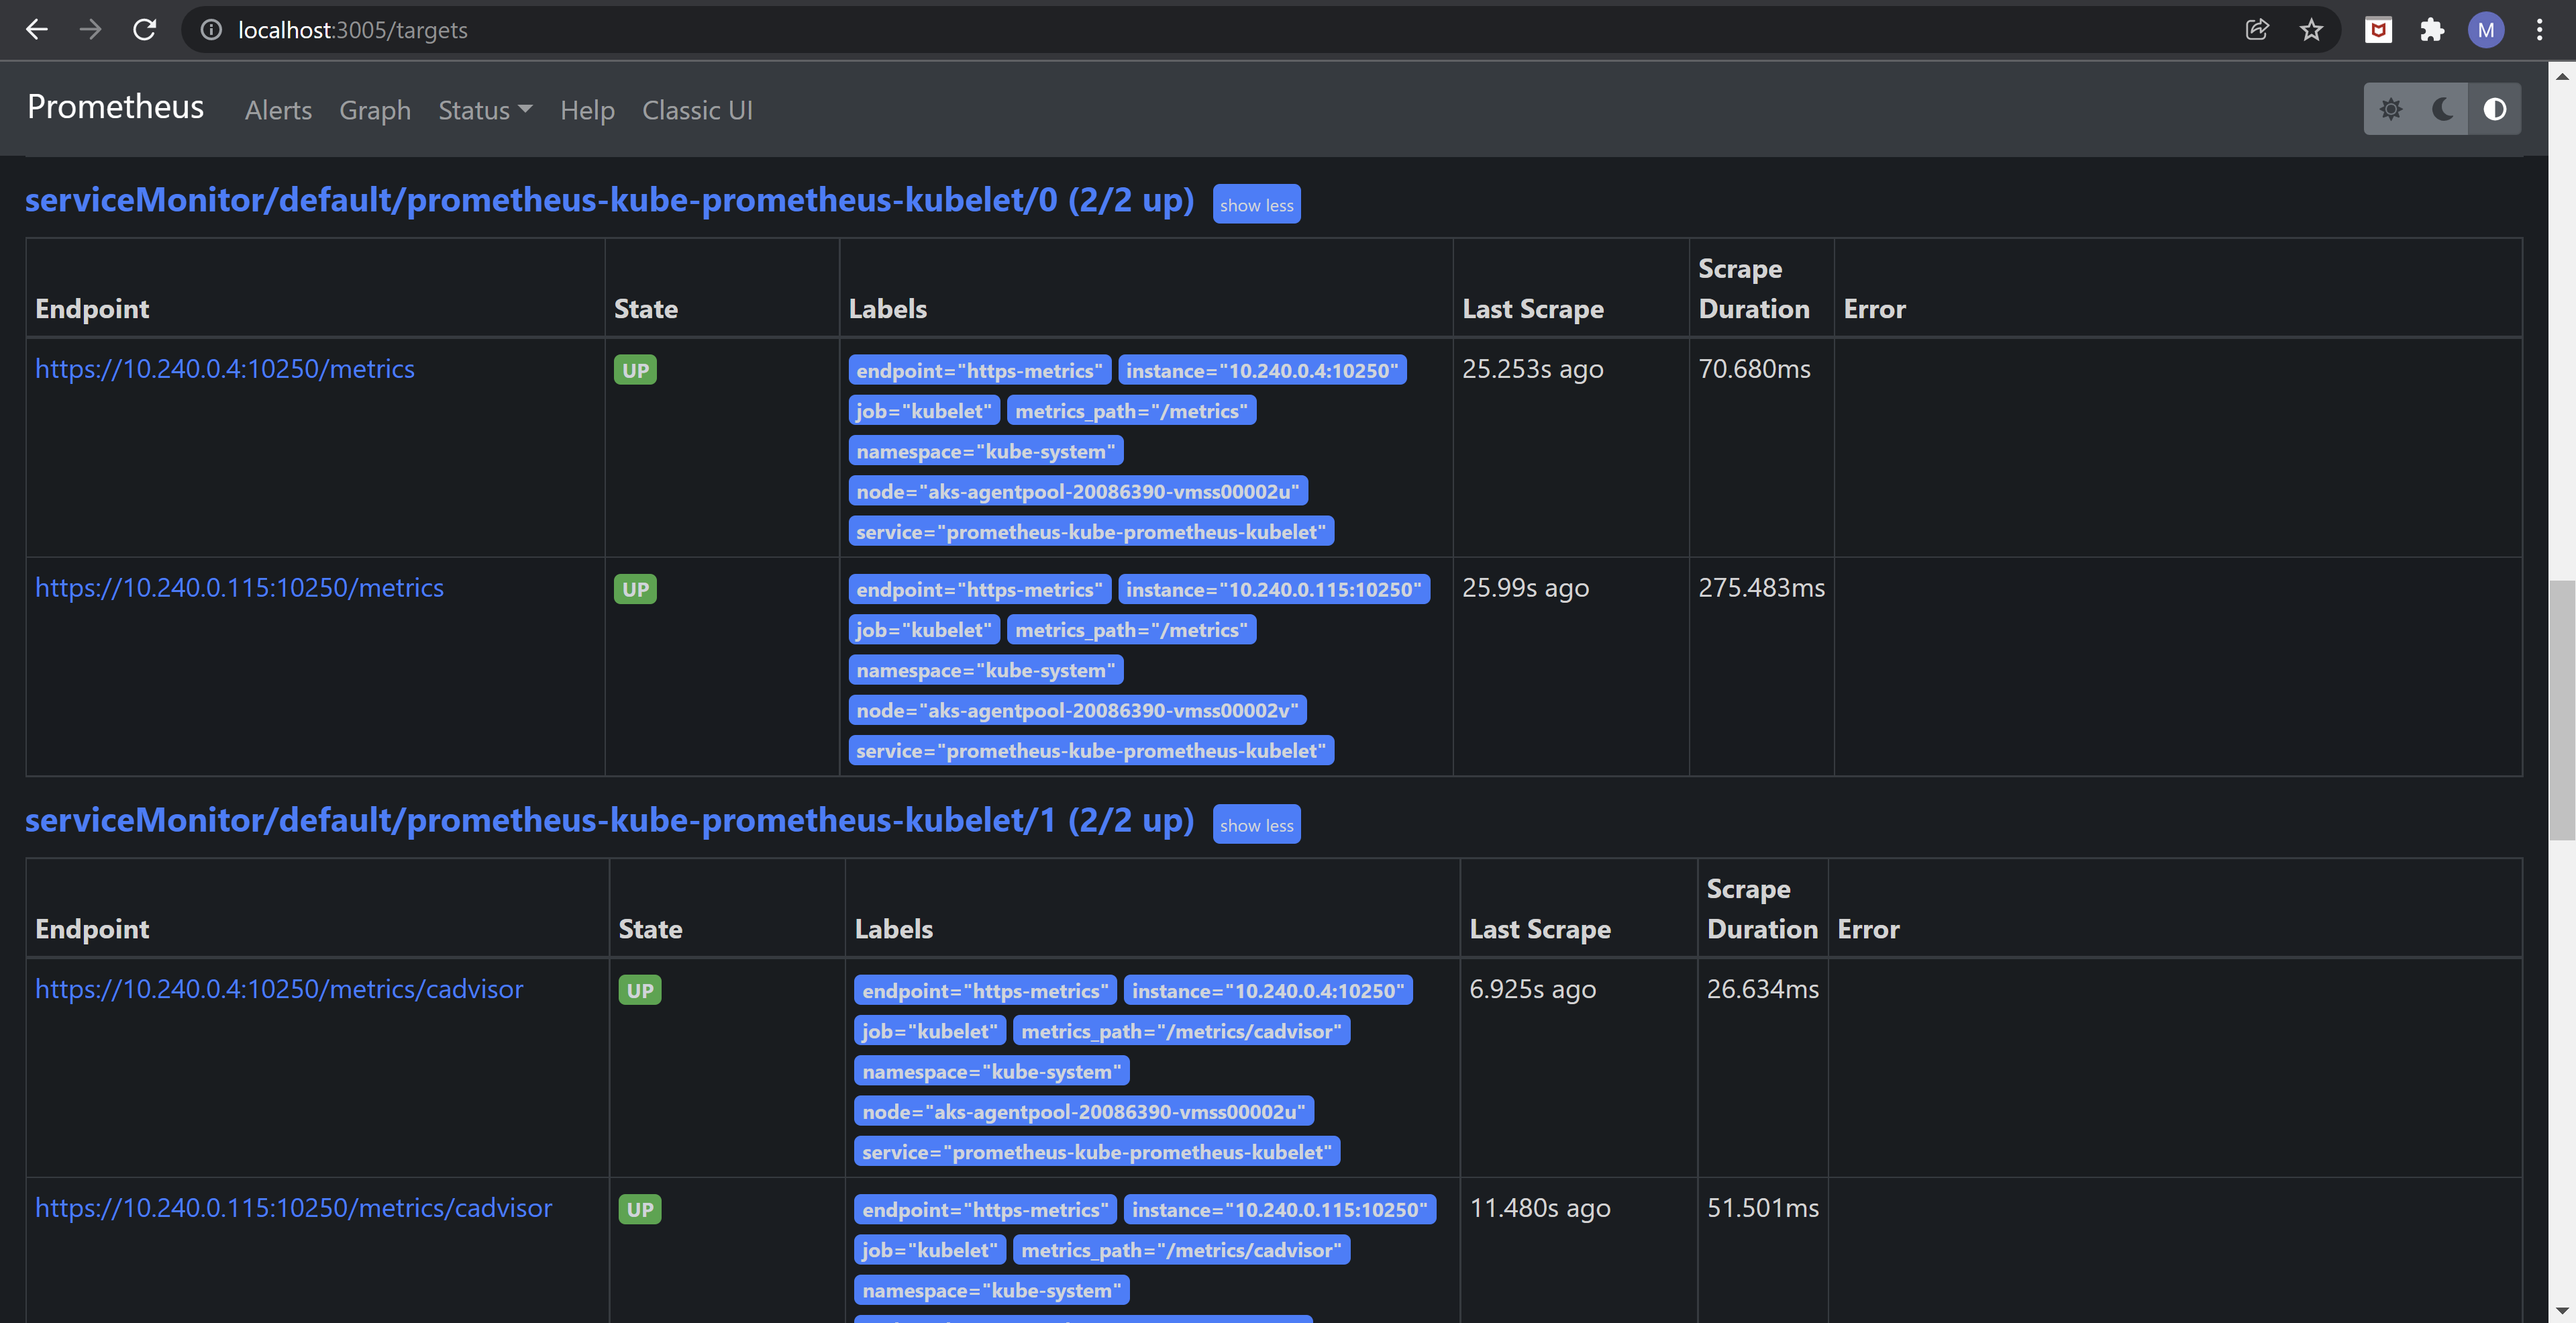
In this partial printscreen you see 2 jobs (for a description of the term “job” see https://prometheus.io/docs/concepts/jobs_instances/) – one for Kubelet’s own metrics endpoint and another for Kubelet’s cAdvisor’s endpoint – each job with 2 endpoints, as there are 2 nodes in our AKS setup.
As this article goes to show, seeing the full list of targets is straightforward: just port forward to the Prometheus service (e.g. kubectl port-forward svc/prometheus-kube-prometheus-prometheus 3005:9090) then point a browser to http://localhost:3005/targets.
It’s this list of targets that was used as input for the diagram back in figure 1 and – aside from those that don’t matter for memory metrics (e.g. AlertManager, CoreDNS, etc) – this dictates where does the Prometheus block connect to. Notice quite a few of the metrics components we’ve discussed previously being scraped for data.
You probably noticed that 2 of the metrics components aren’t being scraped. The first is the Summary API endpoint which, as we’ve seen back in Endpoints section, provides its data in JSON format. This coupled with the fact that most of its data come from cAdvisor – which Prometheus already scrapes directly – explains why the Summary API endpoint is not a Prometheus target. The second one is the Resource Metrics endpoint, which also doesn’t bring any advantage to be scraped by Prometheus: given it relies on the Summary API code to get its own data, which in turn gets most of its data from cAdvisor, collecting the data would just be double-work as Prometheus already scrapes cAdvisor directly. In fact inside the values file for the kube-prometheus-stack Helm chart there’s a comment right next to the Kubelet’s Resource Metrics config: “this is disabled by default because container metrics are already exposed by cAdvisor“. Keep in mind though that the Resource Metrics API is due to replace the Summary API eventually, so this will probably change at one point.
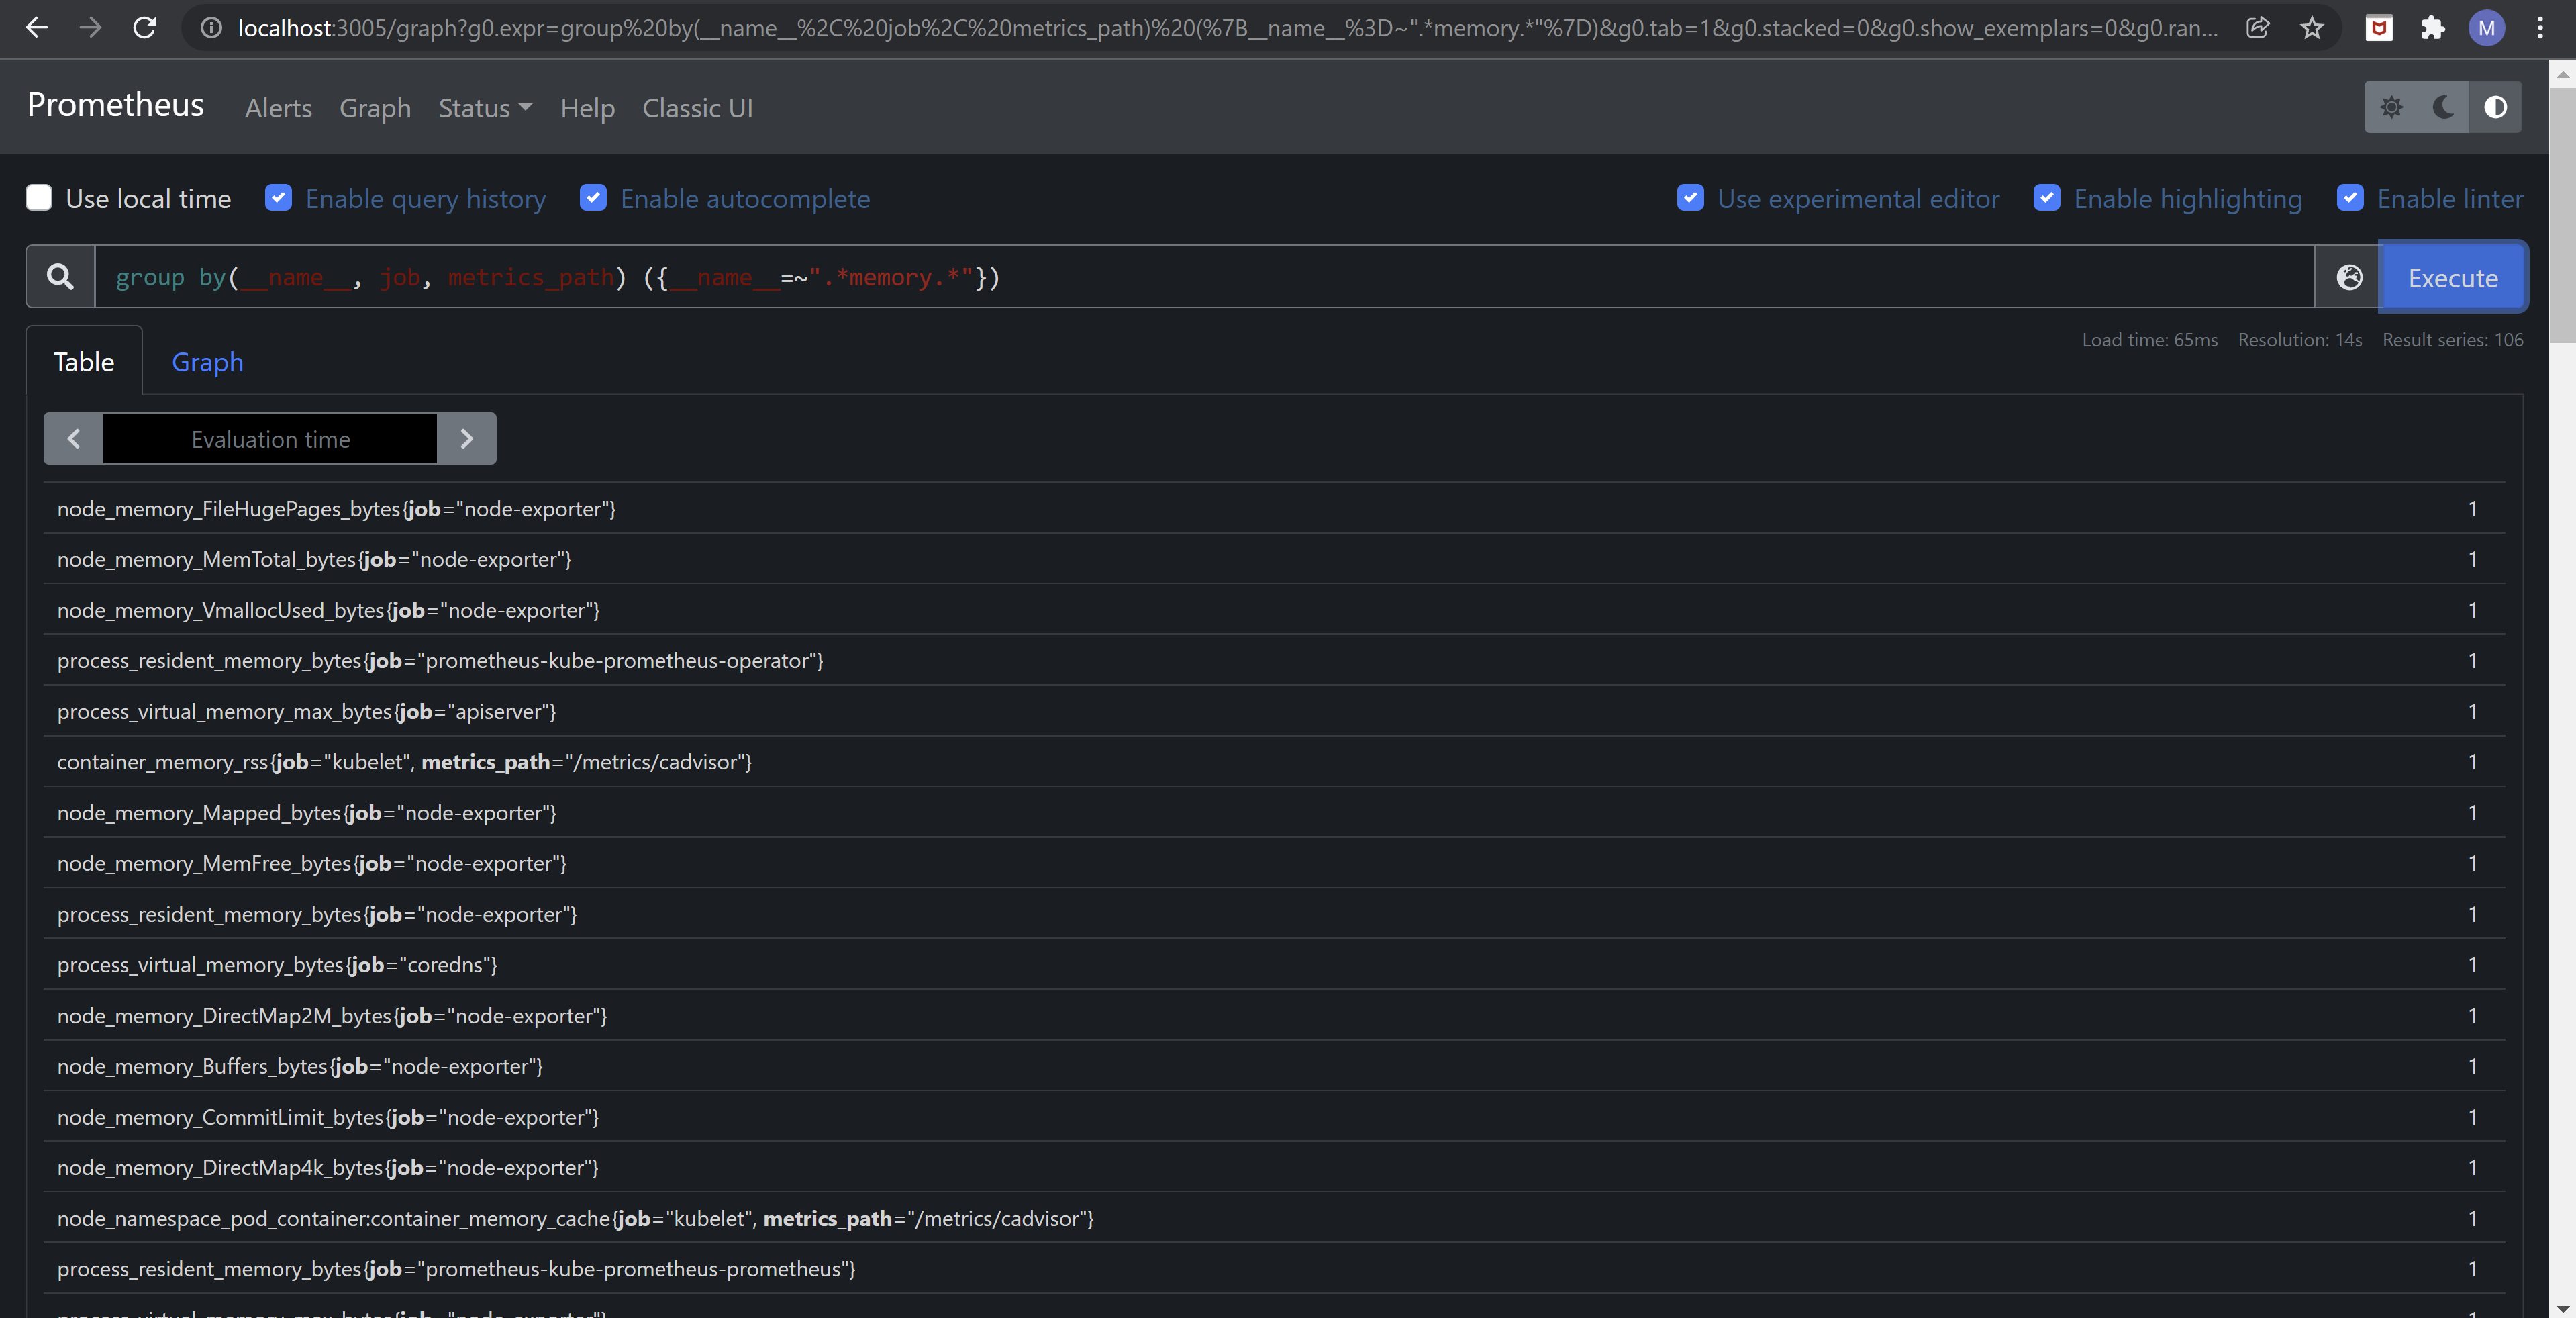
How about the metrics? As Prometheus is scraping from multiple targets, we expect to find quite a few metrics available. And even more important, how to filter for memory metrics only? Turns out there’s a nice way to list not only the metrics we’re interested in but also the source where they were scraped from. The key for that is the labels that Prometheus attaches to the metrics collected, which help uniquely identify their source endpoint. Using this very good article https://promlabs.com/blog/2020/12/17/promql-queries-for-exploring-your-metrics, we can build PromQL queries that return just what we’re after. To quickly see the results of the queries, either use the Prometheus’ UI “Graph” tab and switch to the “Table” output or use Grafana’s “Explore” view. A couple of examples:
group by(__name__) ({__name__!="", metrics_path="/metrics/cadvisor"})This obtains only the names of the metrics provided by the Kubelet’s cAdvisor target. The query works because that particular metric path is unique for cAdvisor, so we don’t even care about the job that does the scrapinggroup by(__name__) ({__name__!="", job="node-exporter"})Gets the names of the metrics obtained by the Prometheus node exportergroup by(__name__) ({__name__=~".*memory.*", job="node-exporter"})Returns only the names of the metrics returned by the node exporter that contain the “memory” stringgroup by(__name__, job, metrics_path) ({__name__=~".*memory.*"})Retrieves the names of all the memory metrics along with the scraping job name and – if it exists – the metrics path, thus uniquely identifying the source
Partial output returned by the last query can be seen below. The order they’re returned in is random, but you can spot the container_memory_rss metric that’s emitted by cAdvisor:
Now that we know which metrics come from where, let’s briefly talk about timings. The first important note is that if the source for a metric suddenly disappears, and doesn’t have any value issued for 5 minutes, then it’s marked as stale and a chart containing it will no longer display it (source here). We’ll run into this situation throughout the article, whereby “ghosts” of metrics data for evicted Kubernetes pods will still linger around, so it’s best to be aware of it from the very beginning. Secondly, we won’t be changing the default intervals when Grafana reports data or when Prometheus scrapes data from its various targets: as such, data will be collected every 30s. As we’ll see, this will be enough for our goals.
One thing worth noting is the metric lifecycle for metrics in Prometheus format which some Kubernetes components – including Kubelet – emit. This is described here and explains why you’ll get to see labels in square brackets next to some metrics. For example, the Resource Metrics endpoint shows “[ALPHA]” for every single metric it returns in our Kubernetes 1.21 AKS cluster used for tests in this article.
A whole book could be written about Prometheus and how it works, but we’ve only went over the minimum knowledge required to understand where the memory metrics it’s collecting are coming from.
kubectl get --raw
We can use this command to query the Kubernetes API server. This will allow us to retrieve raw metric values directly from the endpoints exposed by the various metrics components we’ll be targeting.
Some examples:
- The Summary API on any node in the cluster can be queried using the instructions here, namely using
kubectl get --raw /api/v1/nodes/<node-name>/proxy/stats/summary. The console output should be similar to the one displayed in this link - The Prometheus node exporter – which by default runs on port 9100 on each node where it’s deployed to – can be queried using
kubectl get --raw /api/v1/nodes/<node-name>:9100/proxy/metrics
Browser, with kubectl proxying directly to the API server
This method also involves talking to the Kubernetes API server, just like kubectl get --raw does, the only difference being that results are outputted in a browser as opposed to the console. To make this work, we’ll need an additional reverse proxy to listen on the port we’ll be targeting our browser at, which we’ll spawn by running kubectl proxy locally. The reverse proxy will thus listen on port 8001 (the default port), and the requests will be sent directly to the Kubernetes API server. With this method we get the regular perks of using kubectl – namely not having to care about authentication or specifying the cluster hostname with each request.
Sticking with the examples from the previous section, we can see the output in a browser, by running kubectl proxy & and then navigating to:
- For the Summary API endpoint:
http://localhost:8001/api/v1/nodes/http://localhost:8001/api/v1/nodes/<node>/proxy/stats/summary. Here’s what this looks like: link - For the Prometheus node exporter:
http://localhost:8001/api/v1/nodes/http://localhost:8001/api/v1/nodes/<node-name>:9100/proxy/metrics. The raw output is here
kubectl top pod / top node
We’re going to use both commands as they’ll give valuable insight. As to the metrics returned by these commands, we’ll analyze this later.
kubectl describe node
We’ll use this command further on as it does give interesting output, as per the official Kubernetes guidance. One thing we need to be aware of is that it doesn’t measure actual usage on that node, but instead just shows how much the request and limits value stack up.
htop
We’ll use htop to investigate both a node’s overall memory stats as well as individual container processes.
Metrics values
We’ve seen the components involved in collecting metrics, listed their endpoints, and saw samples for each that contained various metrics. We’ve also seen in Tools for viewing metrics some of the memory metrics that Prometheus extracts from the various metrics component inside Kubernetes. On the other hand, if one searches through the metrics components’ endpoints’ samples list of metrics (the last column in the 3 tables in the Endpoints section) for the “memory” string, there are quite a few hits as well.
But what do all these metrics actually represent? There’s node_memory_Active_bytes, node_memory_working_set_bytes, container_memory_working_set_bytes, container_memory_rss and a dozen others. It’s obvious that there’s not just a single metric called “memory”.
Another problem is where does each metric exposed by the metrics components coming from? Seeing the actual source of data for each metric component will help us understand to what degree we can compare the metrics they produce. We’ll be able to answer questions such as: Is cAdvisor’s container_memory_working_set_bytes the same as the Kubelet’s Resource Metrics endpoint container_memory_working_set_bytes? Or: Is the Kubelet’s Summary API endpoint’s rssBytes inside the memory section of a container equal to the cAdvisor’s container_memory_rss?
Thus the goal of this section is to “link” the memory metrics coming from the metrics components to the underlying “low-level” metrics as exposed by the underlying OS.
Let’s go through each endpoint and tool, and see how the metrics that will be most relevant further on are built. We’ll start with the ones that do most of the “heavy work” and gradually move to those that only process them:
cAdvisor endpoint
Which are the memory metrics published by cAdvisor? From which base metrics are they being obtained? Analyzing the code (see How does cAdvisor get its memory metric data? and How does cAdvisor publish the internal metrics it collects as Prometheus metrics?) gives us:
| cAdvisor metric | Source OS metric(s) | Explanation of source OS metric(s) | What does the metric mean? |
container_memory_cache | total_cache value in the memory.stat file inside the container’s cgroup directory folder | number of bytes of page cache memory | Size of memory used by the cache that’s automatically populated when reading/writing files |
container_memory_rss | total_rss value in the memory.stat file inside the container’s cgroup directory folder | number of bytes of anonymous and swap cache memory (includes transparent hugepages). […]This should not be confused with the true ‘resident set size’ or the amount of physical memory used by the cgroup. ‘rss + mapped_file’ will give you resident set size of cgroup” | Size of memory not used for mapping files from the disk |
container_memory_mapped_file | total_mapped_file value in the memory.stat file inside the container’s cgroup directory folder | number of bytes of mapped file (includes tmpfs/shmem) | Size of memory that’s used for mapping files |
container_memory_swap | total_swap value in the memory.stat file inside the container’s cgroup directory folder | number of bytes of swap usage | |
container_memory_failcnt | The value inside the memory.failcnt file | shows the number of times that a usage counter hit its limit | |
container_memory_usage_bytes | The value inside the memory.usage_in_bytes file | doesn’t show ‘exact’ value of memory (and swap) usage, it’s a fuzz value for efficient access. (Of course, when necessary, it’s synchronized.) If you want to know more exact memory usage, you should use RSS+CACHE(+SWAP) value in memory.stat | Size of overall memory used, regardless if it’s for mapping from disk or just allocating |
container_memory_max_usage_bytes | The value inside the memory.max_usage_in_bytes file | max memory usage recorded | |
container_memory_working_set_bytes | Deduct inactive_file inside the memory.stat file from the value inside the memory.usage_in_bytes file. If result is negative then use 0 | inactive_file: number of bytes of file-backed memory on inactive LRU listusage_in_bytes: doesn’t show ‘exact’ value of memory (and swap) usage, it’s a fuzz value for efficient access. (Of course, when necessary, it’s synchronized.) If you want to know more exact memory usage, you should use RSS+CACHE(+SWAP) value in memory.stat | A heuristic for the minimum size of memory required for the app to work |
The 3rd column you see is the official definition, as found in the official cgroups v1 docs while the 4th gives a “plain English” explanation of what that metric actually measures.
There is a very good article written a while back here that explains the container metrics in an excellent way. It’s this one that helped me get further understanding. But let’s go over some important aspects of these metrics:
- Notice the “page cache” term on the definition of the
container_memory_cachemetric. In Linux the page cache is “used to cache the content of files as IO is performed upon them” as per the “Linux Kernel Programming” book by Kaiwan N Billimoria. You might be tempted as such to think thatcontainer_memory_mapped_filepretty much refers to the same thing, but that’s actually just a subset: e.g. a file can be mapped in memory (whole or parts of it) or it can be read in blocks, but the page cache will include data coming from either way of accessing that file. See https://stackoverflow.com/questions/258091/when-should-i-use-mmap-for-file-access for more info - There’s one important note for the RSS metric as per section 5.2 here https://www.kernel.org/doc/Documentation/admin-guide/cgroup-v1/memory.rst: “Only anonymous and swap cache memory is listed as part of ‘rss’ stat. This should not be confused with the true ‘resident set size’ or the amount of physical memory used by the cgroup. ‘rss + mapped_file’ will give you resident set size of cgroup“. This is reflected in the table above and has a powerful implication: the
RSSmetric in this context doesn’t include anything that’s file-related. So having memory pages backed by files will not have any effect on it. This is unlike the OS-level metric ofVmRSSthat will be discussed further down, which includes file mappings container_memory_mapped_filewill only track those files that have been mapped explicitly usingmmap. Will simply reading a file usingreadas opposed tommapresult in memory pages mapping that file? No, as the kernel reads that directly and just supplies the data to the user. See https://stackoverflow.com/a/41419353/5853218- Swap is an interesting topic, as it was enabled at one point in Kubernetes’ history (GitHub issue here) then got disabled by default, and now it’s making a comeback (GitHub issue here). The official docs as of now (Feb 2022) clearly state that “Kubernetes does not support swap“. Since it’s not currently used (unless you enable the feature gate yourself; also the feature only went alpha in 1.22) we’ll leave it aside for now
- The
container_memory_usage_bytes metricincludes both RSS (memory that’s not used to map files from the disk) as well as the page cache (which uses memory exclusively to map files from the disk), so in effect this metric counts memory access indiscriminately of its purpose - Behind
inactive_file‘s definition in the table above is a simpler explanation – as the code analysis linked previously shows – it just accounts for the memory size used for caching files which can be safely “pushed out” of memory. This in turn makes thecontainer_memory_working_set_bytesmetric simpler to grasp as more closely tracking the RSS, the only difference separating them beingactive_file. - You might find it weird that there are no node statistics reported by cAdvisor. There are some “machine_” metrics just as detailed in the cAdvisor link here, but those only refer to the hardware. There is node usage data obtained as explained in How come cAdvisor’s own endpoint doesn’t return any node data, but the Resource Metrics endpoint (that queries cAdvisor in turn) does?, but it only uses the root memory cgroup. And while this allows seeing some memory stats across all the processes on the OS, you don’t get to see detailed node-level memory stats. Why? Because cAdvisor’s focus is containers, as per the readme page on the git repo: “It is a running daemon that collects, aggregates, processes, and exports information about running containers“. And it’s one of the reasons why the Prometheus node exporter exists
Summary API endpoint
As the code shows in How does the Summary API endpoint get its metrics? the Summary API endpoint can query both the container runtime and cAdvisor to get metric data. But due to the bug described here CRI stats are overwritten by cAdvisor ones for Summary API the only memory metric coming from the container runtime – container_memory_working_set_bytes – is overwritten with data from the same metric provided by cAdvisor. Thus the memory metrics that the Summary API endpoint returns are as of now (Feb 2022) essentially coming exclusively from cAdvisor.
You’ll notice a section for node stats that are being returned (see the sample for the Summary API endpoint back in Table 1 and use a JSON parser to look for a “memory” attribute right underneath the “node” one), but those are just the root cgroups stats, as discussed at length here How come cAdvisor’s own endpoint doesn’t return any node data, but the Resource Metrics endpoint (that queries cAdvisor in turn) does?.
The name of the metrics for the Summary API endpoint don’t match that of its sources (cAdvisor and/or container runtime) e.g. cAdvisor’s container_memory_working_set_bytes becomes workingSetBytes. How this comes to be, along with the name of the metrics, is discussed here What decides the names of the metrics that the Summary API endpoint is emitting, considering that its data comes from cAdvisor and/or the container runtime? For a correspondence between metrics names obtained from cAdvisor and the Summary API endpoint see this nice table created by Peter Hunt (just be aware that the container_memory_working_set_bytes comes from cAdvisor as of Feb 2022, not CRI, as explained in this GitHub issue).
A final note is that the output doesn’t consist in Prometheus metrics, but instead just JSON.
Resource Metrics endpoint
The Resource Metrics API exposes just one memory metric for both nodes and containers/pods: the memory working set size. There’s container_memory_working_set_bytes, pod_memory_working_set_bytes, and node_memory_working_set_bytes. Same as with the Summary API endpoint – and since the Resource Metrics endpoint gets its data from the Summary API endpoint -, due to the bug described here CRI stats are overwritten by cAdvisor ones for Summary API the only memory metric coming from the container runtime – container_memory_working_set_bytes – is overwritten with data from the same metric provided by cAdvisor.
Where the metrics for the Resource Metrics endpoint are coming from in the code – including their name and source – can be seen at length in How come cAdvisor’s own endpoint doesn’t return any node data, but the Resource Metrics endpoint (that queries cAdvisor in turn) does?
An interesting note here that describes how memory is calculated in the metrics pipeline (concretely the “metrics pipeline” is the Resource Metrics API) is reflected in the table below for the first metric. The same text is present verbatim inside the Metrics Server’s docs describing how memory usage is computed.
| Resource Metrics metric | Source metrics component | Explanation of source metric(s) |
container_memory_working_set_bytes | cAdvisor / container runtime* | the amount of memory in-use that cannot be freed under memory pressure[…] It includes all anonymous (non-file-backed) memory since Kubernetes does not support swap. The metric typically also includes some cached (file-backed) memory, because the host OS cannot always reclaim such pages. See the cAdvisor table for the formula containing base OS metrics |
pod_memory_working_set_bytes | cAdvisor / container runtime* | memory working set size at the pod level, by summing up the working set size for each of its containers |
node_memory_working_set_bytes | cAdvisor / (?)container runtime* | aggregation of all processes’ memory working set bytes by extracting the usage for the memory working set size at the root cgroup level. Pulled from cAdvisor’s container_memory_working_set_bytes for the root container (id=”/”). See the cAdvisor metric table |
But why is the working set including all the anonymous pages in the description above? A program typically doesn’t need all the memory it has allocated so far to be present in RAM, and under normal circumstances that would get swapped out to disk when memory becomes scarce. But in Kubernetes this just isn’t possible, as swap is currently disabled (not for long though).
Prometheus node exporter
From a memory metric standpoint, the Prometheus node exporter parses the proc/meminfo pseudo-file (source code) on the respective Linux host and emits a metric for each value inside. The name of the metric is taken as-is from inside that pseudo-file (with round brackets converted to underscores (source code) and prepended with node_memory_ as it can be seen in the sample provided back in Table 2 in the Metrics components section. Additional documentation can be found here.
There is no explicit metric that would track the working set size at the host level. Which would be nice as it could be compared directly to the Resource Metrics endpoint’s node_memory_working_set_bytes, itself simply obtained from cAdvisor which in turn computes it based on the cgroup pseudo-files (see the cAdvisor table above). Yet there is a formula that can be used at the node level that tracks node_memory_working_set_bytes fairly close: node_memory_anonPages_bytes + node_memory_Active_file_bytes. It’s obtained by rewriting the formula for container_memory_working_set_bytes as memory_rss + active_file, given that memory_rss contains the size of all the anonymous pages (either active or inactive) then simply mapping it to the host metrics as seen above. In practice I’ve seen it work fairly ok, for a few dozen nodes with 7.2 GB the drift ranged from a few MiB to around 100 MiB.
Here’s a comparison for our AKS test cluster with just 2 nodes. One is off by ~20 MiB while the others by less than 10 MiB:
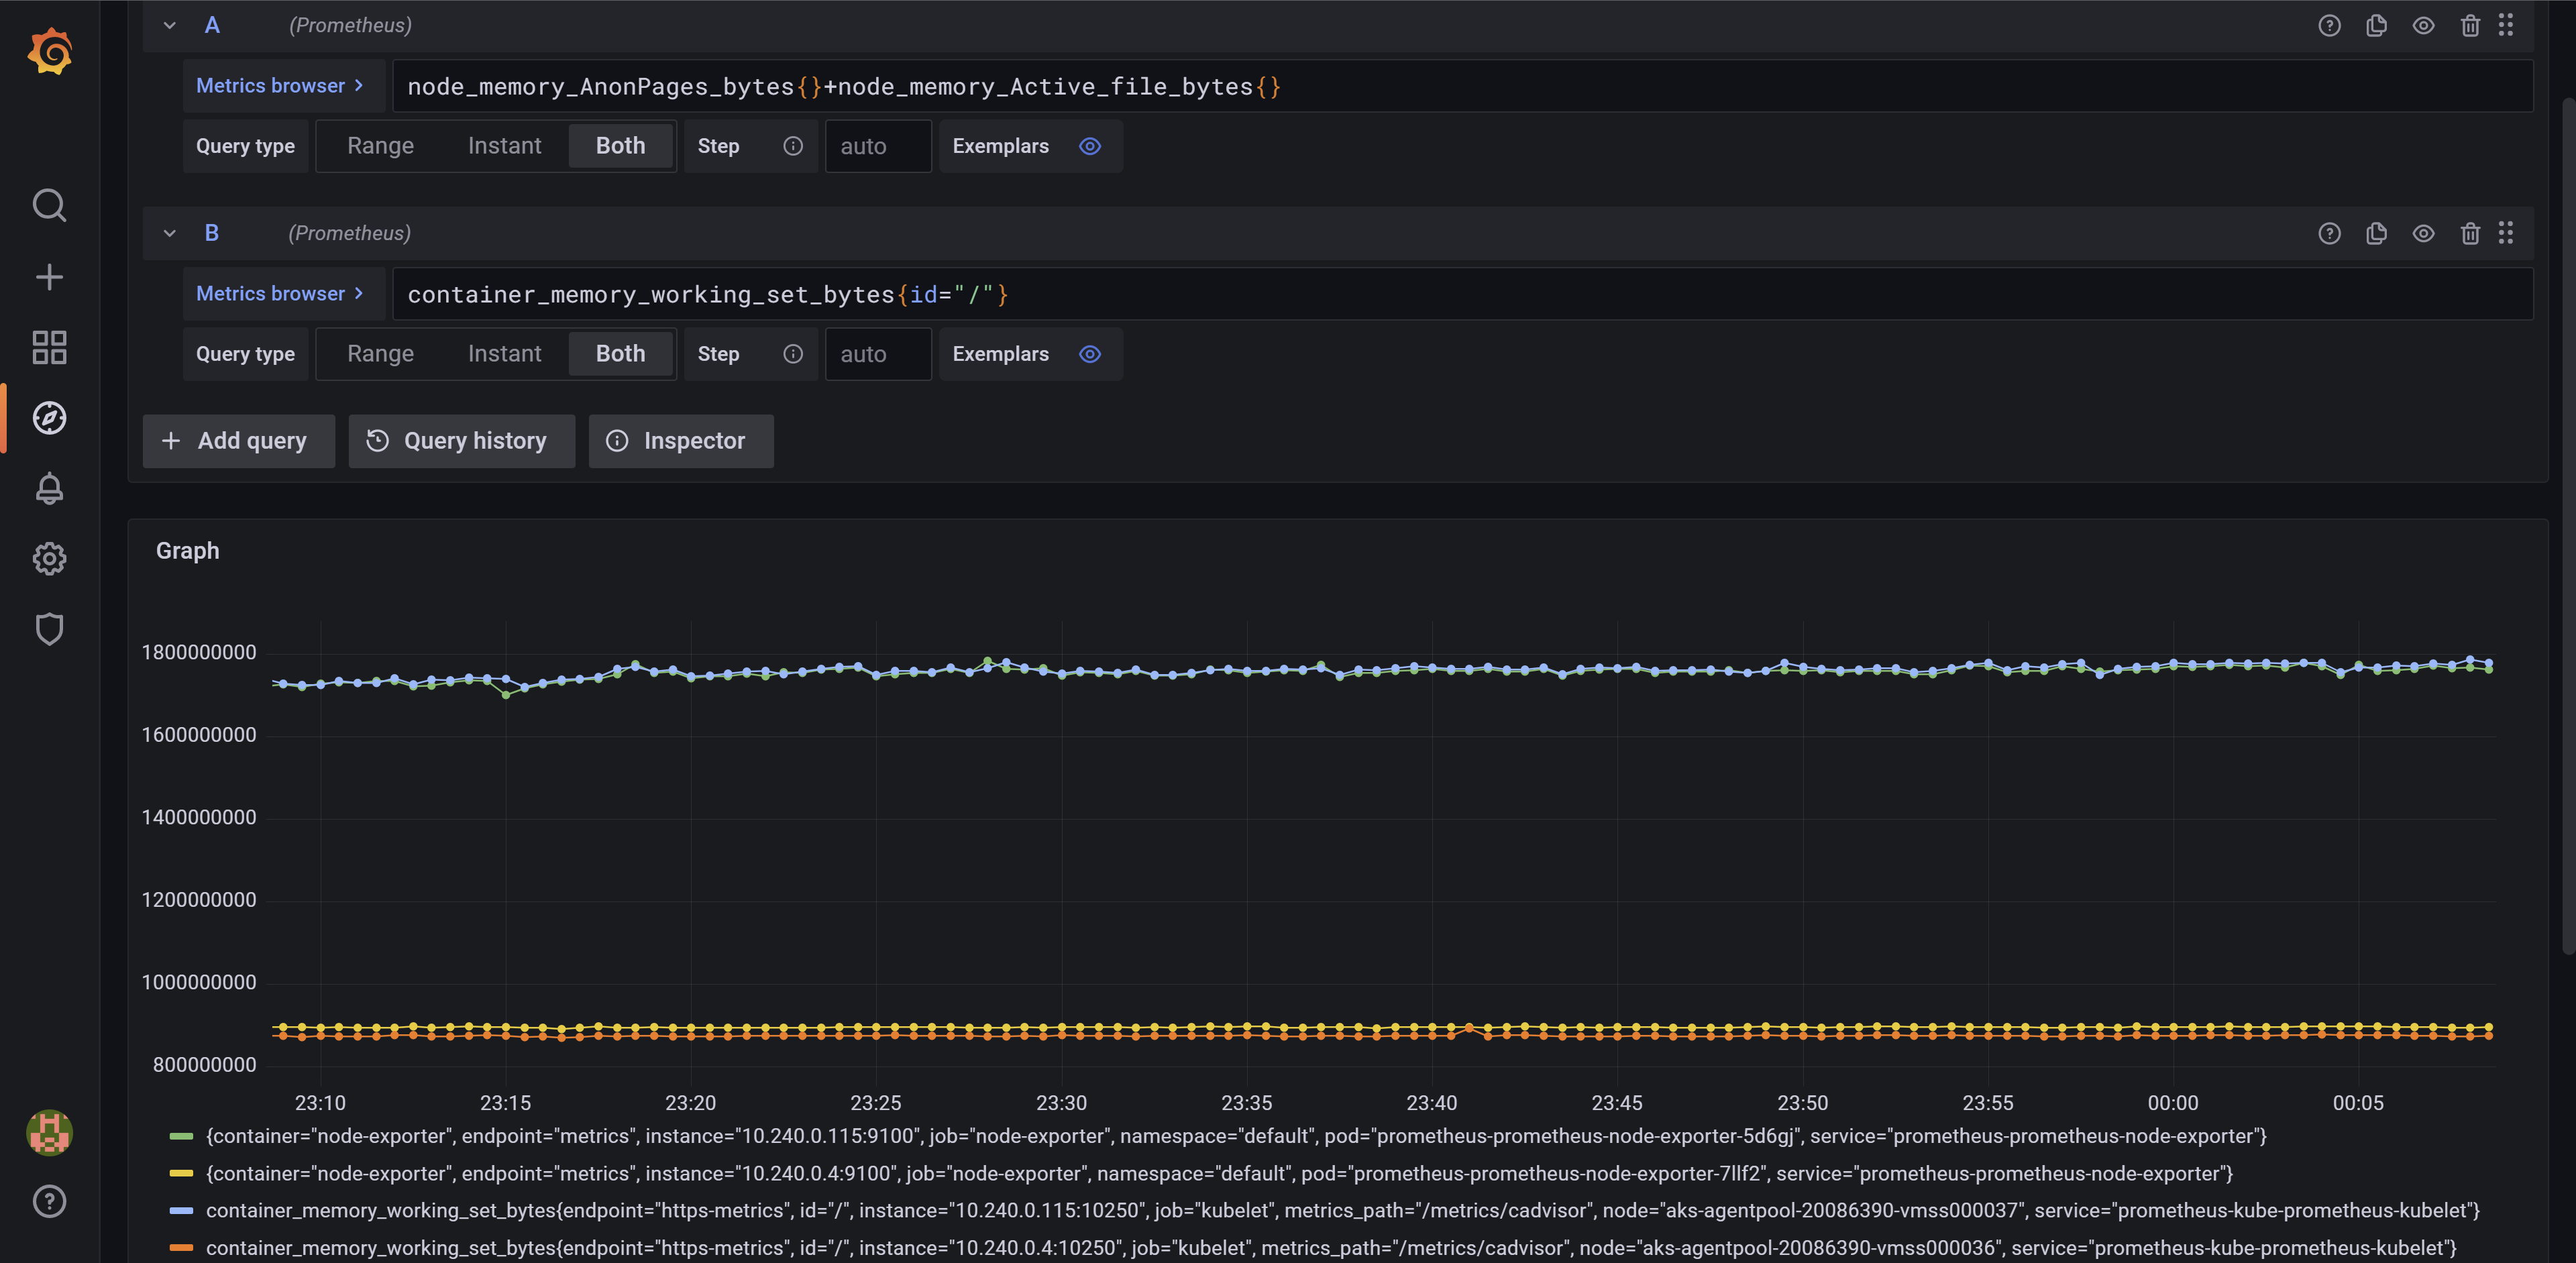
Figure 4 – cAdvisor’s working set size for the memory root cgroup vs Prometheus node exporter metrics formula
Why the small difference? I suspect I’m rather missing something in the formula, than the kernel not updating the values correctly.
Prometheus
We’ve seen previously in the Prometheus section (when discussing various tools) how to filter only the metrics we’re interested in, based on their name and the target from where they were scraped. As we want memory metrics, we’ll focus on those metrics that have “memory” in their name and that are coming from the most valuable targets in this regard: Prometheus node exporter and cAdvisor.
We’ve already seen the list of cAdvisor memory metrics for containers back in Table 4, while metrics from the Prometheus node exporter have been discussed just previously.
Grafana
Grafana’s default Kubernetes dashboards – that we’ve looked at previously – show their memory info based on a few Prometheus metrics collected. Leaving aside memory requests/limits and focusing only on the actual usage metrics, we have these four:
container_memory_working_set_bytescontainer_memory_rsscontainer_memory_cachecontainer_memory_swap
The first metric is present on 2 endpoints: the cAdvisor and Resource metrics endpoints on the Kubelet; but we know that Prometheus doesn’t use the Resource Metrics endpoint as a target for now (it’s present in the configuration but it’s disabled since cAdvisor provides the same things currently). The remaining 3 metrics are present on one single endpoint: cAdvisor. Thus we know all 4 metrics are coming from cAdvisor.
kubectl top pod / node
It’s easy to identify the metric being reported here, as we know it’s the Metrics Server providing this information. In turn, the Metrics Server goes to the Resource Metrics API endpoint as seen in Where can I see that the Metrics Server talks to the /metrics/resource endpoint on the Kubelet to retrieve memory stats?
If you look through the Metrics Server code referenced above, you’ll see it’s not the pod_memory_working_set_bytes used, but instead the Metrics Server computes its own pod metrics based on container_memory_working_set_bytes.
As for the node metrics, node_memory_working_set_bytes returned by the Resource Metrics endpoint is just an aggregation of the cgroup stats as seen here: How come cAdvisor’s own endpoint doesn’t return any node data, but the Resource Metrics endpoint (that queries cAdvisor in turn) does?
Note that the memory usage shown by kubectl top node is different than what the sum of kubectl top pod adds up to. It’s the node working set obtained from the root memory cgroup (“/”) which covers every possible process versus the working set for the containers located in the pods scheduled. It’s almost guaranteed that the former will be bigger than the latter. Why? Because the node’s OS and various system components running aside the containers have to be accounted for as well.
htop
htop reports a few metrics for memory, both at the process/thread level and for the machine overall. Let’s look at the relevant per-process metrics first, with help from htop’s “Setup” (F2) menu:
VIRT: Total program size in virtual memory. As we’ve seen in another blog post this is not that useful. The underlying column name in htop’s setup menu isM_SIZE. Inside the code, printing this value is done here https://github.com/hishamhm/htop/blob/59166da773d8a9a97c8f1b087346865bc8cda9fa/Process.c#L440 based on the fieldm_size, which for Linux gets set here https://github.com/hishamhm/htop/blob/59166da773d8a9a97c8f1b087346865bc8cda9fa/linux/LinuxProcessList.c#L479 using the first value found in the/proc/<pid>/statmfile, which we know from the proc man page that it represents “total program size (same as VmSize in /proc/[pid]/status)“RES: Resident set size, size of the text and data sections, plus stack usage. The underlying column name in htop’s setup menu isM_RESIDENT. Found inside htop’s code on adjacent lines to the metric analyzed in the previous section, it’s using the second value found in the/proc/<pid>/statmfile, which we know from the docs proc man page that it represents “resident set size (inaccurate; same asVmRSSin /proc/[pid]/status)“SHR: Size of the process’s shared pages.. The underlying column name in htop’s setup menu isM_SHARE. In code it’s printed here https://github.com/hishamhm/htop/blob/59166da773d8a9a97c8f1b087346865bc8cda9fa/linux/LinuxProcess.c#L346 based on the fieldm_sharewhich is read here https://github.com/hishamhm/htop/blob/59166da773d8a9a97c8f1b087346865bc8cda9fa/linux/LinuxProcessList.c#L481 as the 3rd field from the same/proc/<pid>/statmfile, which we know from the proc man page that it means “number of resident shared pages (i.e., backed by a file) (inaccurate; same as RssFile+RssShmem in /proc/[pid]/status)“
In the top global pane: Mem and Swp. Note that the style of both bars can be changed to show explicit values (use F2, choose “Meters” select Memory or Swap then push [Space] to toggle between styles). As per htop’s author’s reply here we know how the values involved are computed. For the memory bar, based on input only from /proc/meminfo the values required for further computations are read in the code here https://github.com/hishamhm/htop/blob/59166da773d8a9a97c8f1b087346865bc8cda9fa/linux/LinuxProcessList.c#L932-L963. Based on those “base” values, the 4 values displayed by the memory bar are computed here https://github.com/hishamhm/htop/blob/59166da773d8a9a97c8f1b087346865bc8cda9fa/linux/Platform.c#L198-L208 as follows:
- Total memory (the value on the right of the slash on the right end of the “Mem” bar when in bar mode or the first value when in text mode):
MemTotal. From the proc man page we know it is “Total usable RAM (i.e., physical RAM minus a few reserved bits and the kernel binary code)“ - Total used memory (the value on the left of the slash on the right end of the “Mem” bar when in bar mode or the green value when in text mode):
MemTotal–MemFree–Buffers–Cached. We’ve seen whatMemTotalmeans previously.MemFreeas per documentation is “The sum of LowFree+HighFree“, but since this leads to some other concepts let’s simplify and just say this is the memory not used for anything.Buffersis defined in the same docs as “Relatively temporary storage for raw disk blocks that shouldn’t get tremendously large (20 MB or so)“.Cachedis “in-memory cache for files read from the disk (the page cache). Doesn’t include SwapCached“. Since Linux will cache accessed files in memory by default, and because when there’s no longer any free memory left Linux will simply reclaim the memory used by that cache, it makes sense to remove theCachedvalue from the size of the actual used memory. WhyMemFreeis deducted is also quite obvious. TheBuffershas a more complicated backstory but to keep it simple let’s agree to lump it into a form of caching, so it also gets deducted in the formula - Buffers (quantity of blue bars in the “Mem” bar when in bar mode or the blue value when in text mode):
Buffers. We’ve seen what they mean, along with the expected size, in the previous paragraphs - Cached (quantity of yellow bars in the “Mem” bar when in bar mode or the yellow value when in text mode):
Cached+SReclaimable–Shmem. We’ve went overCachedbefore, but let’s see what the other 2 mean:SReclaimableis “part of Slab, that might be reclaimed, such as caches“. What’s a Linux slab? It’s the building block for the caches used to store kernel structures, and – as per “Linux Kernel Development” book – they “are composed of one or more physically contiguous pages“.Shmemmeans “amount of memory consumed in tmpfs(5) filesystems“. According to the tmpfs man page, tmpfs “allows the creation of filesystems whose contents reside in virtual memory. Since the files on such filesystems typically reside in RAM, file access is extremely fast“.
As a side note, a thorough article into the workings of htop – not just limited to memory – is here: https://peteris.rocks/blog/htop/.
Memory leak tool
The tool is using System.Diagnostics.Process.GetCurrentProcess().WorkingSet64 to get the working set size (on Windows) or the resident set size (on Linux). The source for this property can be seen at https://source.dot.net/#System.Diagnostics.Process/System/Diagnostics/Process.cs,616c96095e9b966c. It simply returns the _processInfo‘s object’s property WorkingSet. Tracking this object (_processInfo) further leads to this line that gets the info set: _processInfo = ProcessManager.GetProcessInfo(_processId, _machineName); Tracking this further for Linux shows that the /proc/<pid>/stat file is parsed in the TryParseStatFile method here https://source.dot.net/#System.Diagnostics.Process/Interop.ProcFsStat.cs,919689226c287e1c and /proc/<pid>/status is parsed in the TryParseStatusFile here https://source.dot.net/#System.Diagnostics.Process/Interop.ProcFsStat.TryReadStatusFile.cs,37f9720552f67923. Next the info for the process is built here https://source.dot.net/#System.Diagnostics.Process/System/Diagnostics/ProcessManager.Linux.cs,0ae5f7d8ec5fc44e. The line of interest to us is WorkingSet = (long)procFsStatus.VmRSS, which represents the VmRSS value picked up from the /proc/<pid>/status file. Its description in proc man page reads “resident set size. Note that the value here is the sum of RssAnon, RssFile, and RssShmem. This value is inaccurate; see /proc/[pid]/statm above“. And the reference to the statm file reads: “some of these values are inaccurate because of a kernel-internal scalability optimization. If accurate values are required, use /proc/[pid]/smaps or /proc/[pid]/smaps_rollup instead, which are much slower but provide accurate, detailed information“.
So taking this “WorkingSet” value with a grain of salt, as it’s openly stated to be inaccurate, let’s see what those 3 components being summed up mean:
- RssAnon: “Size of resident anonymous memory” as per the proc man page. What is anonymous memory? Memory that’s not used to map a file that exists on the filesystem
- RssFile: “Size of resident file mapping”. In other words, the sum of the space taken by all the memory pages used to map files
- RssShmem: “Size of resident shared memory (includes System V shared memory, mappings from tmpfs(5), and shared anonymous mappings)“. As it involves shared memory, it’s likely that we might be double-counting (sum of process 1’s WorkingSet and process 2’s WorkingSet will be larger than the actual sizes should the 2 processes share memory pages) and we should be careful
One last note for the WorkingSet64 property: it uses the same exact source of data as htop for its RES field, as the second value found in the /proc/<pid>/statm file retrieved by htop is identical to the VmRSS value taken from inside /proc/<pid>/status which the property uses.
The tool also uses System.Diagnostics.Process.GetCurrentProcess().PrivateMemorySize64 to get the amount of private memory (which is defined here as “the amount of memory, in bytes, allocated for the associated process that cannot be shared with other processes“). Its value is obtained also in the TryParseStatusFile method here https://source.dot.net/#System.Diagnostics.Process/Interop.ProcFsStat.TryReadStatusFile.cs,37f9720552f67923 but 2 values are summed up from the /proc/<pid>/status file: VmData + VmStk. The proc man page state that they are the size of data and stack segments respectively. Why are these 2 summed up? Probably to reflect what the process uses for itself (aka private), and since the text segment (where the code is located) can be shared (by spawning multiple instances of that process), it’s left aside thus leaving only the 2: the data segment (variables defined by the application itself and the heap where allocations will take place) and the stack segment.
Adventures in Code
The goal of this section is to present in detail the various code analysis done. The main parts of the blog posts that reference the sections here are thus kept relatively clean, and this allows the reader the possibility to evade the burden of going through a level of detail that may not be required.
Running unit tests and compiling Go code
If you’re using a Go IDE on Windows, clone one of the repos discussed in this article, and try to navigate to various files you might run into “Unresolved reference” errors by just looking at the code. For example, opening the cAdvisor code in JetBrains GoLand and going to container/libcontainer/handler.go will show several such errors. The reason is Go build constraints and a mismatch between what the code expects as the underlying OS (usually Linux) and the one where the IDE is running. The problem – and the fix – are detailed in this JetBrains issue: you simply override the OS the IDE is presenting (in JetBrains GoLand go to Settings->Go->Build Tags & Vendoring and edit the OS field to show “linux”).
But still you’ll have issues on Windows: for example the TestCRIListPodCPUAndMemoryStats unit test in pkg/kubelet/stats/cri_stats_provider_test.go of the Kubernetes repo will fail to gather network statistics unless you run as administrator (at least in GoLand). More still, some parts of the tests will not run at all as they’re guarded by checks for runtime.GOOS against the “linux” string (and the IDE OS setting described previously doesn’t help in this case). The good news is that there’s an elegant solution: do the build, running or testing via WSL2.
GoLand can use your distro of choice under WSL2 to run Go apps, and this is actually the way I’ve run unit tests throughout this section under a native Linux environment although the IDE was opened on Windows. How to setup things so this works is described here https://blog.jetbrains.com/go/2021/05/05/compile-and-run-go-code-using-wsl-2-and-goland/. For the target Linux system, just make sure you install Go https://go.dev/doc/install and you’re all set.
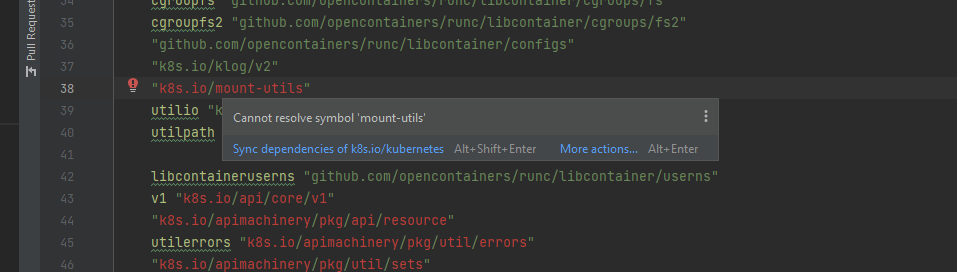
Keep in mind that when opening a repo for the first time, or when changing the current branch you might run into “Cannot resolve symbol” errors. To fix this in GoLand just hover on the unresolved dependency and click the “Sync dependencies of” as seen in the printscreen below. That should take care of all the remaining problems.
How does the Summary API endpoint get its metrics?
We know the Summary API endpoint is /stats/summary, so let’s start from the code that processes the requests. In here https://github.com/kubernetes/kubernetes/blob/v1.21.2/pkg/kubelet/server/server.go#L345 we can see the /stats path being registered. In the CreateHandlers function https://github.com/kubernetes/kubernetes/blob/v1.21.2/pkg/kubelet/server/stats/handler.go#L111 the /summary path is registered https://github.com/kubernetes/kubernetes/blob/v1.21.2/pkg/kubelet/server/stats/handler.go#L122. This in turn leads us to the handleSummary function https://github.com/kubernetes/kubernetes/blob/v1.21.2/pkg/kubelet/server/stats/handler.go#L139, whose comment states “Handles stats summary requests to /stats/summary“.
When the /stats/summary endpoint is queried, the Get method here https://github.com/kubernetes/kubernetes/blob/v1.21.2/pkg/kubelet/server/stats/handler.go#L156 is invoked. This method has only one implementation (not counting the ones in unit tests, since we don’t care about those now) here https://github.com/kubernetes/kubernetes/blob/v1.21.2/pkg/kubelet/server/stats/summary.go#L67, and its receiver argument is of type *summaryProviderImpl. Inside this Get method we have several operations going on: the node name that the Kubelet is running on is retrieved, node statistics are built, etc. But let’s focus just on the code that retrieves the pod statistics. As the input parameter supplied was false, the pod stats are obtained using this line https://github.com/kubernetes/kubernetes/blob/v1.21.2/pkg/kubelet/server/stats/summary.go#L91. Following the only viable implementation (the shortcut for displaying all possible implementations of a method is Ctrl+Alt+B in JetBrains GoLand on Windows) lands us in this method https://github.com/kubernetes/kubernetes/blob/v1.21.2/pkg/kubelet/kubelet.go#L1184. This is just a one-liner: return kl.StatsProvider.ListPodStats(). The question is which implementation to follow, as there are 2 viable ones: the first for cAdvisorStatsProvider and the second for criStatsProvider. To answer this, we have to see how the StatsProvider field on the Kubelet variable is built.
The Kubernetes cluster we’re looking at in this article is an AKS one, which in recent versions at the time of this writing (Dec 2021) is using containerd as its runtime. As there’s a push going forward to get all the statistics completely from the CRI (container runtime interface) as opposed to cAdvisor, it’ll make sense to look at the latest official release at this time, which is v1.23.1; as such the links that follow will point accordingly.
The StatsProvider field we’re looking for gets set in this if block https://github.com/kubernetes/kubernetes/blob/v1.23.1/pkg/kubelet/kubelet.go#L707-L727. The branch that gets executed depends on the value of kubeDeps.useLegacyCadvisorStats. This one in turn is set by the line here https://github.com/kubernetes/kubernetes/blob/v1.23.1/pkg/kubelet/kubelet.go#L340. The UsingLegacyCadvisorStats function is defined here https://github.com/kubernetes/kubernetes/blob/v1.23.1/pkg/kubelet/cadvisor/util.go#L76. We know what this function returns, as the container runtime for AKS in recent versions is no longer Docker (which is what the first condition checks) and the container runtime endpoint is not equal to the CrioSocket variable (which is defined as “/var/run/crio/crio.sock“) as we can see in the Kubelet logs what that one really is (after running chroot /host in a debug container, journalctl -u kubelet shows that: --container-runtime-endpoint="unix:///run/containerd/containerd.sock". Therefore the return value is false.
So coming back to the point where the StatsProvider property is set on the Kubelet object, the branch that will be executed is klet.StatsProvider = stats.NewCRIStatsProvider(...). The NewCRIStatsProvider function is declared here https://github.com/kubernetes/kubernetes/blob/v1.23.1/pkg/kubelet/stats/provider.go#L37. The function’s description reads “NewCRIStatsProvider returns a Provider that provides the node stats from cAdvisor and the container stats from CRI“. Among the parameters to this function are currently 2 bool values corresponding to 2 feature gates, of which one is PodAndContainerStatsFromCRI; neither feature gate is currently enabled (journalctl -u kubelet | grep -i "feature-gates" includes some, but not those 2). The NewCRIStatsProvider function builds a new statistics provider using several parameters, among them an interface to cAdvisor and an invocation for the newCRIStatsProvider function here https://github.com/kubernetes/kubernetes/blob/v1.23.1/pkg/kubelet/stats/cri_stats_provider.go#L85. This function in turn returns a pointer to a newly instantiated struct of type criStatsProvider.
Of all the fields there, the runtimeService internalapi.RuntimeService looks the most promising judging by its comment “// runtimeService is used to get the status and stats of the pods and its managed containers“. So let’s see what is used as runtime service for the Kubelet. The functions inside the cri_stats_provider.go appear to call the underlying object for the container runtime to get the metrics themselves. Inside this file https://github.com/kubernetes/kubernetes/blob/release-1.21/staging/src/k8s.io/cri-api/pkg/apis/runtime/v1alpha2/api.proto there’s a comment towards the beginning that says “// Runtime service defines the public APIs for remote container runtimes“. Inside the same file are RPC calls defined as messages to be exchanged.
Now that we know that StatsProvider is of type criStatsProvider, we know which implementation to follow for the ListPodStats method https://github.com/kubernetes/kubernetes/blob/v1.21.2/pkg/kubelet/kubelet.go#L1184, which leads us here https://github.com/kubernetes/kubernetes/blob/v1.23.1/pkg/kubelet/stats/cri_stats_provider.go#L108. Following the next few calls, and taking into account that the PodAndContainerStatsFromCRI feature gate is not set for out test cluster, we’ll end up in the listPodStatsPartiallyFromCRI method https://github.com/kubernetes/kubernetes/blob/v1.23.1/pkg/kubelet/stats/cri_stats_provider.go#L158. It’s here were statistics are extracted, both from the container runtime (this line https://github.com/kubernetes/kubernetes/blob/v1.23.1/pkg/kubelet/stats/cri_stats_provider.go#L167) as well as from cAdvisor (this line https://github.com/kubernetes/kubernetes/blob/v1.23.1/pkg/kubelet/stats/cri_stats_provider.go#L171). The problem is that instead of the (currently few) container runtime stats to be used as a “primary source” and for the cAdvisor ones to supplement those that the container runtime doesn’t yet capture, the code eventually overwrites the container runtime stats with cAdvisor ones similar to what I’ve described in this bug https://github.com/kubernetes/kubernetes/issues/107172.
How can I see that the Resource Metrics endpoint gets its data from the Summary API?
When the endpoint /metrics/resource is registered here https://github.com/kubernetes/kubernetes/blob/v1.21.2/pkg/kubelet/server/server.go#L385 the function NewResourceMetricsCollector is invoked a few lines down here https://github.com/kubernetes/kubernetes/blob/v1.21.2/pkg/kubelet/server/server.go#L387.
The NewResourceMetricsCollector function https://github.com/kubernetes/kubernetes/blob/v1.21.2/pkg/kubelet/metrics/collectors/resource_metrics.go#L80 takes as argument s.resourceAnalyzer and returns an object of type metrics.StableCollector. That resourceAnalyzer variable is initially set here https://github.com/kubernetes/kubernetes/blob/v1.21.2/pkg/kubelet/kubelet.go#L597 on the Kubelet object itself. The method invoked to create the variable – NewResourceAnalyzer – is defined here https://github.com/kubernetes/kubernetes/blob/v1.21.2/pkg/kubelet/server/stats/resource_analyzer.go#L41. This function returns a pointer to a struct that contains among its fields an instance of the SummaryProvider interface that’s created inside the Summary API code using the Kubelet’s StatsProvider, as seen here https://github.com/kubernetes/kubernetes/blob/v1.21.2/pkg/kubelet/server/stats/summary.go#L52.
The CollectWithStability method https://github.com/kubernetes/kubernetes/blob/v1.21.2/pkg/kubelet/metrics/collectors/resource_metrics.go#L110 inside the Resource Metrics endpoint code has a receiver argument of type *resourceMetricsCollector, just like the one that was previously returned by the NewResourceMetricsCollector function.
We’ve briefly looked at how the metrics are obtained by the Resource Metrics endpoint in the <q “How come cAdvisor’s own endpoint doesn’t return any node data, but the Resource Metrics endpoint (that queries cAdvisor in turn) does?” But let’s dig a bit deeper. Inside the CollectWithStability method the line statsSummary, err := rc.provider.GetCPUAndMemoryStats() https://github.com/kubernetes/kubernetes/blob/v1.21.2/pkg/kubelet/metrics/collectors/resource_metrics.go#L115 calls one of the 2 methods that the SummaryProvider interface (which the provider field points to an implementation of) defines: one is Get, which retrieves a full set of metrics including file system, network, etc and the second is GetCPUAndMemoryStats which – as its name states – just takes the CPU and memory stats. All the methods that retrieve the various statistics inside these 2 are called against the Kubelet’s StatsProvider, which is either initialized to (1) provide data from cAdvisor exclusively or (2) provide some data from the container runtime and the rest from cAdvisor (for a larger analysis on how this decision is made between the 2 options can be found in How does the Summary API endpoint get its metrics?). So how the Kubelet’s StatsProvider is initialized will dictate where the metrics are coming from.
One of the reasons the Resource Metrics API was created in the first place is to retrieve a small set of metrics, hence the reason for it providing only limited metrics, obtained just for CPU and memory.
The SummaryProvider interface that the field on which the GetCPUAndMemoryStats method is called implements has only one implementation of type summaryProviderImpl, which is located inside the Summary API code https://github.com/kubernetes/kubernetes/blob/v1.21.2/pkg/kubelet/server/stats/summary.go#L39. It’s in the same place where the code for the GetCPUAndMemoryStats method is located https://github.com/kubernetes/kubernetes/blob/v1.21.2/pkg/kubelet/server/stats/summary.go#L120.
Back in the Resource Metrics endpoint code, out of the “reduced” metric set returned by the Summary API, only a handful are kept and emitted. For container memory metrics, only one makes it: container_memory_working_set_bytes packed in this metric https://github.com/kubernetes/kubernetes/blob/v1.21.2/pkg/kubelet/metrics/collectors/resource_metrics.go#L50 and then emitted here https://github.com/kubernetes/kubernetes/blob/v1.21.2/pkg/kubelet/metrics/collectors/resource_metrics.go#L100.
There is actually a way to get the Summary API endpoint to generate this “reduced” set of metrics, as the handler code here https://github.com/kubernetes/kubernetes/blob/v1.21.2/pkg/kubelet/server/stats/handler.go#L146-L152 shows that using the only_cpu_and_memory query parameter set to true will call the same method that the Resource Metrics endpoint eventually calls into: GetCPUAndMemoryStats.
Here’s a side-by-side view that contrasts the data returned by the Summary API endpoint (showing the “reduced” metrics obtained by specifying the only_cpu_and_memory=true parameter) and that returned by the Resource Metrics endpoint. Note that aside the changed metric names, the values for the only container memory metric returned by the Resource Metrics endpoint (container_memory_working_set_bytes) is identical to that returned by the Summary API endpoint (workingSetBytes):
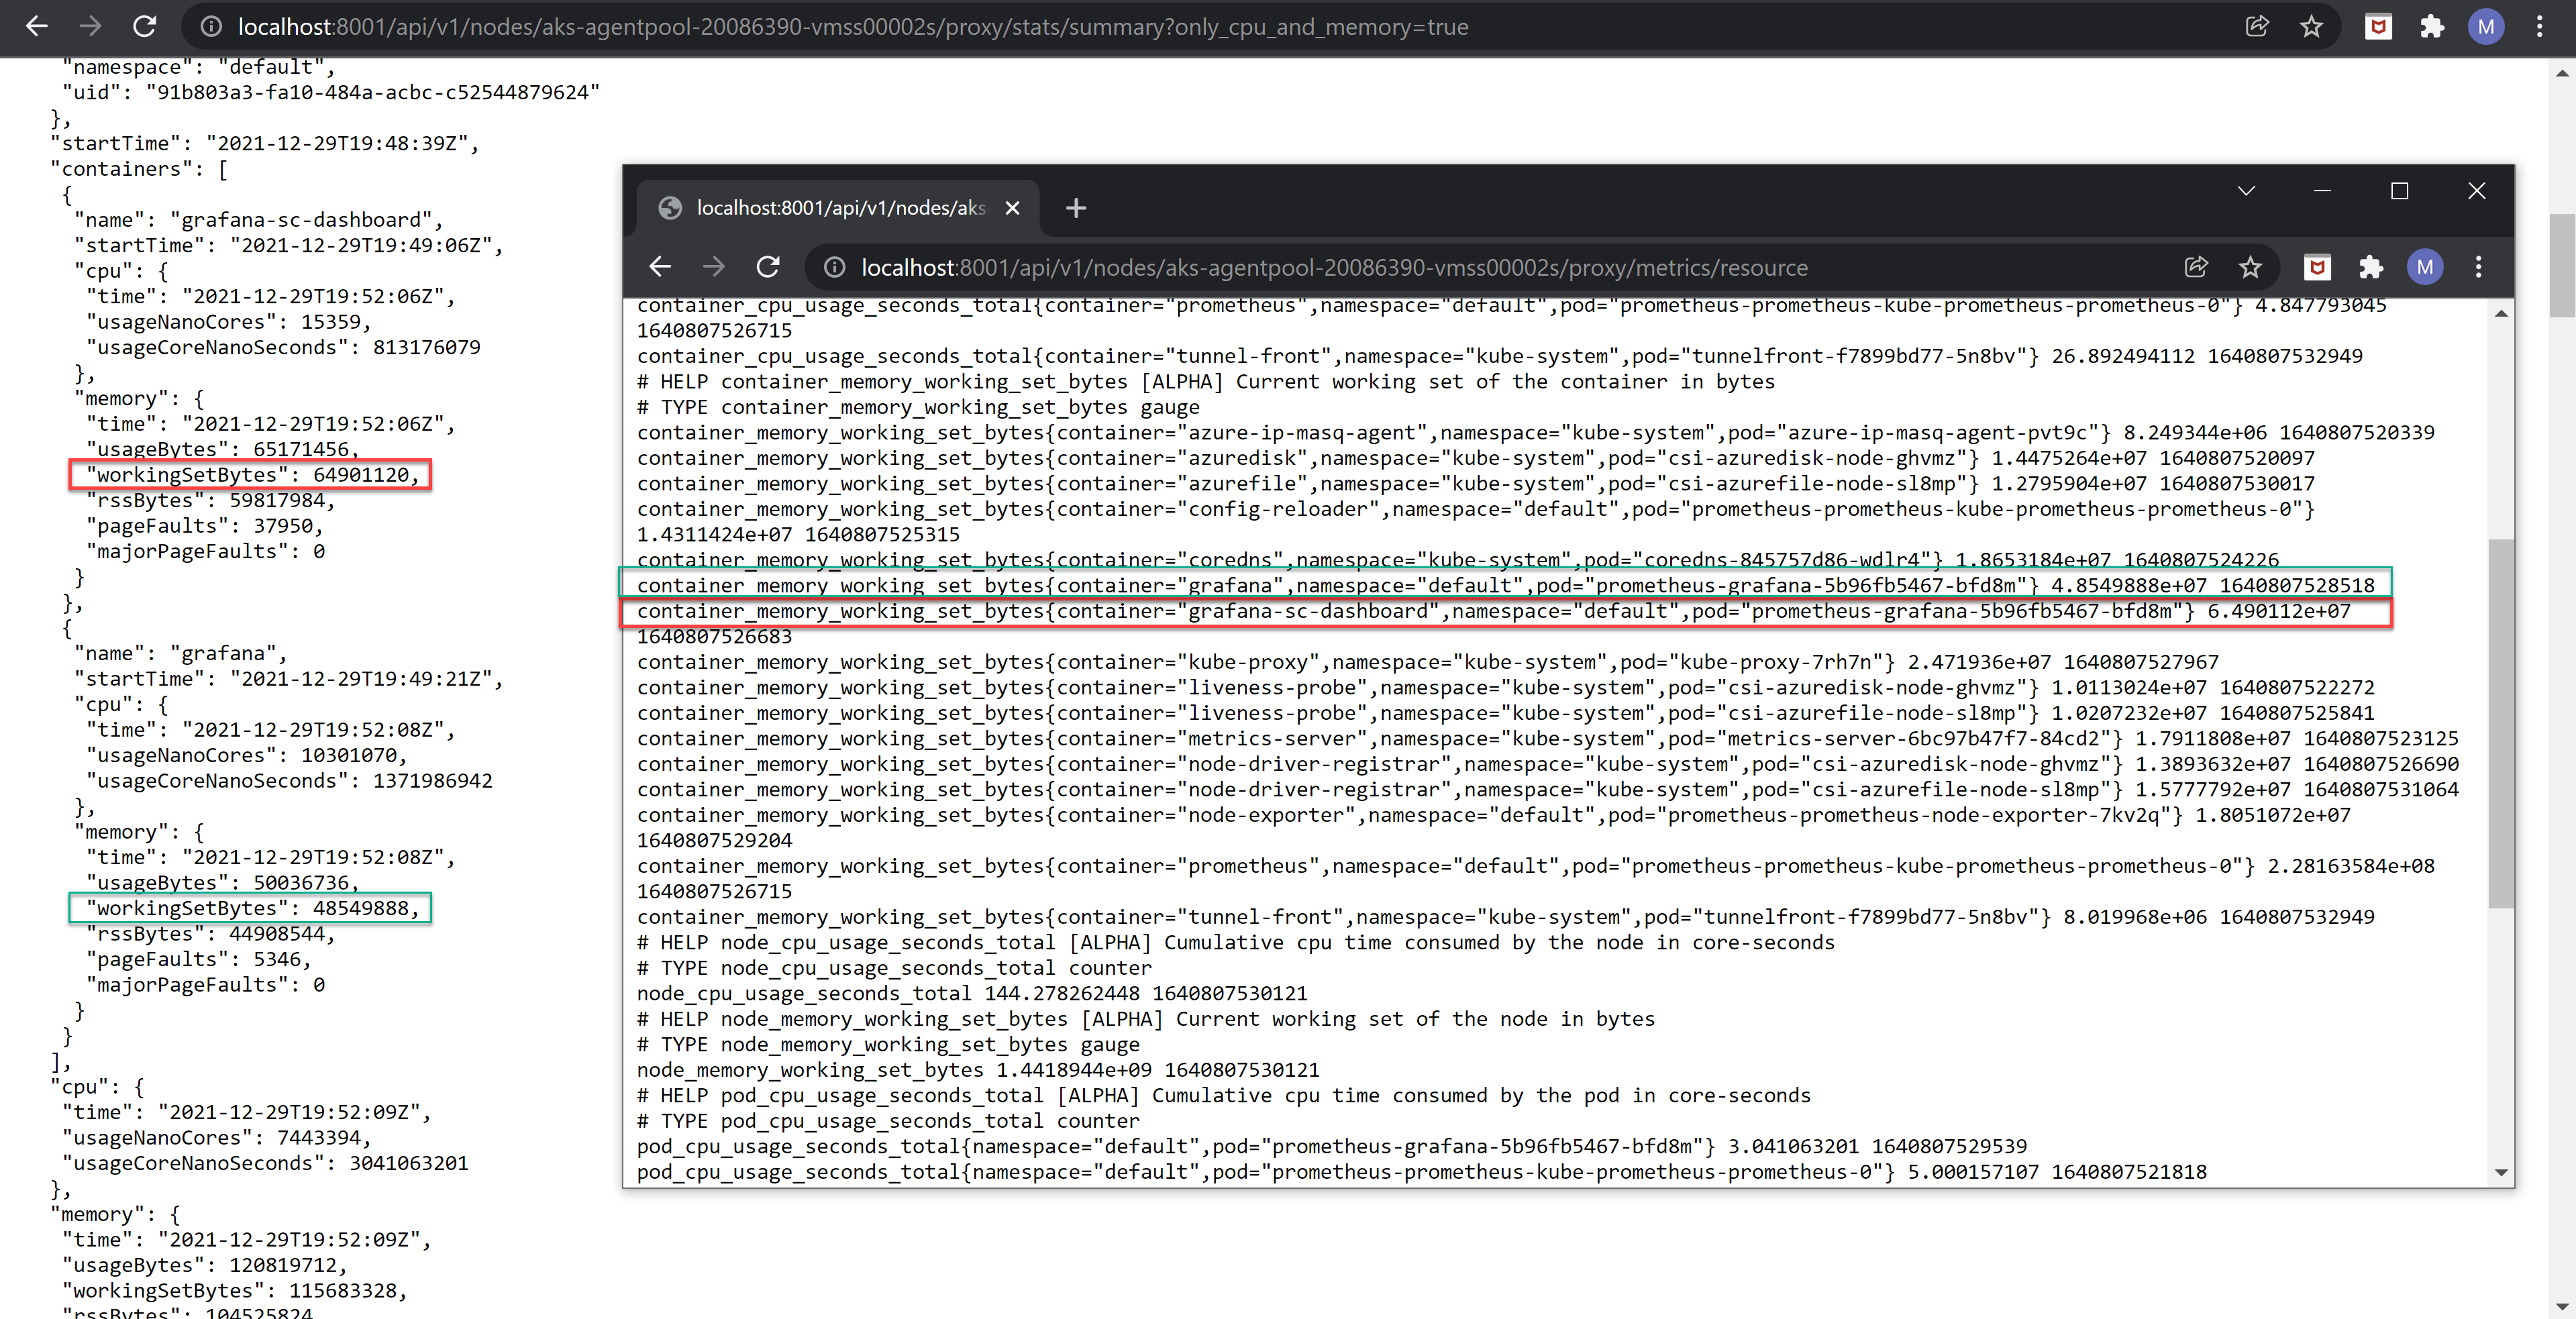
To conclude: the Resource Metrics endpoint defines a few metrics of its own, but then relies on the Summary API code to actually retrieve the CPU and memory metrics via the Kubelet stats provider, and finally “packages” only some using its own metric names and exposes them.
How does cAdvisor get its memory metric data?
Note: the permalinks for the master branch on cAdvisor repo are given as of 12/17/2021: e0fab623. Note that the permalinks for runc are for the v1.0.2 tag, as this is what cAdvisor references currently on this date in Dec 2021 in its go.mod file. Also, we’re only talking about cgroups v1.
Regardless of the container runtime in use, its GetStats method https://github.com/google/cadvisor/blob/e0fab6233991e198fe53c25ee031e3d5a42c3f05/container/libcontainer/handler.go#L75 – which is called for every container as its comment states (most likely via the *Handler receiver argument) – eventually calls into the setMemoryStats function defined in container/libcontainer/handler.go https://github.com/google/cadvisor/blob/e0fab6233991e198fe53c25ee031e3d5a42c3f05/container/libcontainer/handler.go#L801 as seen below.

But inside that function we only get to see values assigned to the variables about to be returned. We’re really interested in what sets those source values – such as s.MemoryStats.Usage.Usage – in the first place. So let’s track their usage: in JetBrains’ GoLand, choose “Find Usages” while hovering over the very last field (the last .Usage for s.MemoryStats.Usage.Usage) and we’ll be presented with this:

Usage fieldWe don’t care about when values are read, but only when they’re written, so we’ll just look inside the “Value write” group. There are only 3 entries inside, each corresponding to a Go package inside the libcontainer library https://github.com/opencontainers/runc/tree/master/libcontainer. The first one isn’t interesting, as there’s only a unit test referenced there, and neither is the 3rd one as at least now (Dec 2021) Kubernetes isn’t yet using cgroups v2 by default (see Am I using group v2). This leaves us with the getMemoryData function inside libcontainer/cgroups/fs/memory.go https://github.com/opencontainers/runc/blob/v1.0.2/libcontainer/cgroups/fs/memory.go#L202. This function obtains the various values it’s after by calling GetCgroupParamUint https://github.com/opencontainers/runc/blob/v1.0.2/libcontainer/cgroups/fscommon/utils.go#L87 against 4 files located on the cgroup filesystem resulting in the following MemoryData fields being assigned to:
Memory.Usagetakes the value inside thememory.usage_in_bytesfile. Documentation https://www.kernel.org/doc/Documentation/admin-guide/cgroup-v1/memory.rst section 5.5 mentions that “usage_in_bytes is affected by the method and doesn’t show ‘exact’ value of memory (and swap) usage, it’s a fuzz value for efficient access. (Of course, when necessary, it’s synchronized.) If you want to know more exact memory usage, you should use RSS+CACHE(+SWAP) value in memory.stat“Memory.MaxUsagetakes the value insidememory.max_usage_in_bytesMemory.Failcnttakes the value insidememory.failcnt. Documentation https://www.kernel.org/doc/Documentation/admin-guide/cgroup-v1/memory.rst section 5.4 states that “This failcnt(== failure count) shows the number of times that a usage counter hit its limit“Memory.Limittakes the value insidememory.limit_in_bytes
Who gets to call getMemoryData? It’s the GetStats method here https://github.com/opencontainers/runc/blob/v1.0.2/libcontainer/cgroups/fs/memory.go#L143, which parses all the data inside memory.stat file – including the “regular” values such as cache, rss, etc as well as the corresponding ones prefixed by “total_” – and places them inside the MemoryStats struct’s Stats field which is a map. Next it calls getMemoryData against the 4 files as seen above.
Now that we know how the source memory metrics data is obtained, let’s go back to our original setMemoryStats function in cAdvisor’s own code, and keeping in mind we’re looking explicitly for cgroup v1 code, this code https://github.com/google/cadvisor/blob/e0fab6233991e198fe53c25ee031e3d5a42c3f05/container/libcontainer/handler.go#L812-L815 will execute. We already know that the MemoryStats.Stats map has its keys and values obtained by parsing the memory.stat file, so the 4 lines will ensure that:
Memory.Cacheis assigned the value fortotal_cacheinsidememory.stat. Docs https://www.kernel.org/doc/Documentation/admin-guide/cgroup-v1/memory.rst section 5.2 define this as “number of bytes of page cache memory“Memory.RSSis assigned the value fortotal_rssinsidememory.stat. Docs https://www.kernel.org/doc/Documentation/admin-guide/cgroup-v1/memory.rstdefine this as “number of bytes of anonymous and swap cache memory (includes transparent hugepages)“Memory.Swapis assigned the value fortotal_swapinsidememory.stat. Docs https://www.kernel.org/doc/Documentation/admin-guide/cgroup-v1/memory.rst define this as “number of bytes of swap usage“Memory.MappedFileis assigned the value fortotal_mapped_fileinsidememory.stat. Docs https://www.kernel.org/doc/Documentation/admin-guide/cgroup-v1/memory.rst define this as “number of bytes of mapped file (includes tmpfs/shmem)“
Just before returning, the working set size represented by Memory.WorkingSet is computed as following:
- 0 if the value inside
memory.usage_in_bytesis lower than the value forinactive_fileinsidememory.stat - the result of subtracting
inactive_fileinside thememory.statfile from the value inside thememory.usage_in_bytesfile, otherwise
inactive_file is defined in the docs https://www.kernel.org/doc/Documentation/admin-guide/cgroup-v1/memory.rst section 5.2 as “number of bytes of file-backed memory on inactive LRU list“. The LRU lists are described in this document https://www.kernel.org/doc/gorman/html/understand/understand013.html with the inactive list described as containing “reclaim candidates” as opposed to the active list that “contains all the working sets in the system“. So in effect the memory size for mapping files from disk that aren’t really required at the time is deducted from the memory usage – itself roughly equivalent as we’ve seen previously with rss+cache+swap (which we’re already reading form memory.stat). If the resulting value is negative, then it’s set to 0.
How does cAdvisor publish the internal metrics it collects as Prometheus metrics?
The memory metrics in Prometheus format the cAdvisor exposes are seen in the code here https://github.com/google/cadvisor/blob/e0fab6233991e198fe53c25ee031e3d5a42c3f05/metrics/prometheus.go#L363-L457. Notice that we’re getting all the metrics we’ve discussed previously (minus Memory.Limit) in How does cAdvisor gets its memory metric data?. Excluding a few metrics that won’t be of interest, the mapping is as follows:
container_memory_cache: source isMemory.Cache, which – for cgroups v1 and hierarchy enabled – gets its value fromtotal_cachewithin thememory.statfile located inside the container’s cgroup directorycontainer_memory_rss: source isMemory.RSS, which – for cgroups v1 and hierarchy enabled – gets its value fromtotal_rssinside thememory.statfilecontainer_memory_mapped_file: source isMemory.MappedFile, which – for cgroups v1 and hierarchy enabled – gets its value fromtotal_mapped_fileinside thememory.statfilecontainer_memory_swap: source isMemory.Swap, which – for cgroups v1 and hierarchy enabled – gets its value fromtotal_swapinside thememory.statfilecontainer_memory_failcnt: source isMemory.Failcnt, which – for cgroups v1 – gets its value from thememory.failcntfilecontainer_memory_usage_bytes: source isMemory.Usage, which – for cgroups v1 – gets its value from thememory.usage_in_bytesfilecontainer_memory_max_usage_bytes: source isMemory.MaxUsage, which – for cgroups v1 – gets its value from thememory.max_usage_in_bytesfilecontainer_memory_working_set_bytes: source isMemory.WorkingSet, which – for cgroups v1 – is assigned the result of subtractinginactive_fileinside thememory.statfile from the value inside thememory.usage_in_bytesfile (and if the outcome is negative, then it’s set to 0)
You can find all of the above in the overall Prometheus metrics list for cAdvisor here Prometheus container metrics.
There are 2 ways to get to the cgroup memory stat files used as source: either by navigating across the full cgroup hierarchy on the respective Kubernetes node e.g. /sys/fs/cgroup/memory/kubepods/burstable/pod4ded2c44-0357-44a5-b795-a64b3f186671/ac9f5dc3be925d966a06d73129b49c36cd7b2961af66d4cd94a6d4c728062ce4 or connect inside the respective container and navigate to /sys/fs/cgroup/memory.
How come cAdvisor’s own endpoint doesn’t return any node data, but the Resource Metrics endpoint (that queries cAdvisor in turn) does?
If one looks at the /metrics/cadvisor endpoint output (see the corresponding sample back in Table 1), there are no node memory metrics whatsoever reported. But when the Resource Metrics API is displaying data, it includes node memory info – and this we know currently comes from cAdvisor (as of Feb 2022 at least, as per this issue). So how come cAdvisor’s own endpoint doesn’t return any node data, but the Resource Metrics endpoint (that queries cAdvisor in turn) does?
cAdvisor does report data about the root cgroup, which is used as data for the node statistics. Cross-checking the cAdvisor value for a memory metric for the root cgroup against the Resource Metrics endpoint value for the node yield an exact value:

Let’s see what happens inside the code (permalinks in the Kubernetes code are as of tag v.1.21.2, the same version the test AKS cluster in the article is using):
- Searching for “node_memory_working_set_bytes” leads to only one relevant source file:
pkg/kubelet/metrics/collectors/resource_metrics.go. Inside we can see thenodeMemoryUsageDescvariable defined by calling theNewDescfunction in themetricspackage (k8s.io/component-base/metrics) which instantiates aDescstruct with the metric string we’re tracking (“node_memory_working_set_bytes“), a description of it (“Current working set of the node in bytes“) and the fact that it’s an ALPHA metric (there’s the article with metrics lifetime here https://kubernetes.io/docs/concepts/cluster-administration/system-metrics/ that explains it). The metric itself has values assigned to it in thecollectNodeMemoryMetricsfunction in the same file. But the parameter containing the value to be used –sof typesummary.NodeStats– is actually instantiated in theCollectWithStabilityfunction in the same file, specifically in this linestatsSummary, err := rc.provider.GetCPUAndMemoryStats()https://github.com/kubernetes/kubernetes/blob/092fbfbf53427de67cac1e9fa54aaa09a28371d7/pkg/kubelet/metrics/collectors/resource_metrics.go#L115. ThisGetCPUAndMemoryStatsmethod is in the Summary API code here https://github.com/kubernetes/kubernetes/blob/092fbfbf53427de67cac1e9fa54aaa09a28371d7/pkg/kubelet/server/stats/summary.go#L120 - So we’ve ended up in the Summary API code. The line
rootStats, err := sp.provider.GetCgroupCPUAndMemoryStats("/", false)https://github.com/kubernetes/kubernetes/blob/092fbfbf53427de67cac1e9fa54aaa09a28371d7/pkg/kubelet/server/stats/summary.go#L128 is important, as the first parameter of that method iscgroupName. A few lines down, therootStatsvariable is used to instantiate aNodeStatsstruct, which is eventually returned to the caller function. So we have proof in the code that’s the root cgroup that’s being used to extract the node statistics. But what’s used to actually retrieve those? Is Summary API calling cAdvisor to get the virtual file from disk, or does it get it itself? Let’s follow theGetCgroupCPUAndMemoryStatsfunction - Choosing GoLand’s “Go To / Implementations” for the
GetCgroupCPUAndMemoryStatsfunction, and then choosing the only interface listed (Provider) lands us inpkg/kubelet/server/stats/handler.go. The text above our target function reads “// The following stats are provided by cAdvisor“. How can we actually make sure it’s cAdvisor being called here? Let’s follow the implementation of theGetCgroupCPUAndMemoryStatsfunction - If we follow the only implementation inside that function, we land eventually in the function
GetCgroupCPUAndMemoryStatshttps://github.com/kubernetes/kubernetes/blob/092fbfbf53427de67cac1e9fa54aaa09a28371d7/pkg/kubelet/stats/provider.go#L110. The first function calledgetCgroupInfois defined here https://github.com/kubernetes/kubernetes/blob/092fbfbf53427de67cac1e9fa54aaa09a28371d7/pkg/kubelet/stats/helper.go#L300. In here a function calledContainerInfoV2is called, that’s eventually calling into cAdvisor code. So it’s quite apparent that indeed the Summary API endpoint inside the Kubelet does get its node metrics from cAdvisor. In turn, we’ve seen that the Resource Metrics endpoint calls into the Summary API endpoint for node statistics. So we can conclude that for node stats the Resource Metrics endpoint calls cAdvisor via the Summary API endpoint.
Are container runtime stats obtained via CRI overwritten by cAdvisor data for the Kubelet Summary API endpoint?
For recent Kubernetes clusters that rely on anything else than Docker as the container runtime – such as AKS by default post v1.19 – at the moment (Dec 2021) this appears to be indeed the case. The details and the code analysis is here https://github.com/kubernetes/kubernetes/issues/107172.
Where can I see that the Metrics Server talks to the /metrics/resource endpoint on the Kubelet to retrieve memory stats?
Let’s look inside the Metrics Server repo https://github.com/kubernetes-sigs/metrics-server/tree/v0.4.4.
The GetMetrics function inside /pkg/scraper/client/resource/client.go targets the /metrics/resource endpoint on a node’s Kubelet, retrieves the HTTP output and then decodes this as metrics by calling the decodeBatch function in /pkg/scraper/client/resource/decode.go. The GetMetrics function is eventually called (via the collectNode method) from the Scrape function inside pkg/scraper/scraper.go for each of the nodes. The same decode.go file also contains the explicit string particles used to parse the outcome from the REST call to the Kubelet’s Resource Metrics API endpoint, e.g. node_memory_working_set_bytes and container_memory_working_set_bytes used for the container and node memory metrics respectively. These 2 memory metrics are stored next by calling the parseNodeMemUsageMetrics and parseContainerMemMetrics respectively, which fill in the MemoryUsage field for the MetricsPoint instance.
Note that the Metrics Server image used inside the AKS test cluster throughout this article uses 0.4.4 as the image version.
What decides the names of the metrics that the Summary API endpoint is emitting, considering that its data comes from cAdvisor and/or the container runtime?
Following the writeResponse function https://github.com/kubernetes/kubernetes/blob/v1.21.2/pkg/kubelet/server/stats/handler.go#L165 that gets called when the Summary API endpoint is rendering its response, we can see that a JSON conversion is performed (this is also expected, as we can clearly see the type of output). The metric names in the JSON output match the actual tags of the various structure fields of the response here https://github.com/kubernetes/kubernetes/blob/v1.21.2/pkg/kubelet/server/stats/summary.go#L113 and all the inner types, such as PodStats https://pkg.go.dev/k8s.io/kubelet/pkg/apis/stats/v1alpha1#PodStats, MemoryStats https://pkg.go.dev/k8s.io/kubelet/pkg/apis/stats/v1alpha1#MemoryStats, etc which according to this SO thread https://stackoverflow.com/questions/30681054/what-is-the-usage-of-backtick-in-golang-structs-definition get encoded automatically.
The mapping of the metric names in the Summary API endpoint’s response to the underlying OS metrics can be obtained by starting in the cadvisorInfoToCPUandMemoryStats function https://github.com/kubernetes/kubernetes/blob/v1.21.2/pkg/kubelet/stats/helper.go#L36, where we see the memory metrics created (the corresponding tags that get emitted in the JSON output are not capitalized though) based on the cAdvisor container stats. E.g. we see that UsageBytes (tag is usageBytes) gets set to the Memory.Usage variable. The variables used along with the source OS virtual files (e.g memory.stat) are the same ones in How does cAdvisor get its memory metric data?. There’s just a single metric that’s newly created: availableBytes that’s the difference between the container’s memory limit and the container’s working set or 0 if no limit is set. One last note is that the cadvisorInfoToCPUandMemoryStats function above gets called regardless of the Kubelet StatsProvider (cAdvisor or container runtime).
What is the memory metric that the Kubelet is using when making eviction decisions?
This line https://github.com/kubernetes/kubernetes/blob/v1.23.1/pkg/kubelet/eviction/memory_threshold_notifier.go#L105 sets up a notification to be generated every time a specific cgroup’s memory usage (refer to the cAdvisor metrics table) crosses a threshold value by following the steps in the cgroups documentation (section 9 here https://www.kernel.org/doc/Documentation/cgroup-v1/memory.txt). Which cgroup is that? That’s defined in https://github.com/kubernetes/kubernetes/blob/v1.23.1/pkg/kubelet/eviction/memory_threshold_notifier.go#L52-L63, and we’ll analyze this code next.
The path computed starts from the memory root cgroup and – should the threshold being processed is the “allocatable” one – a string (cgroupRoot) gets appended to it on line 62. What is this string’s value?
To find out we obtain the point in code when the NewMemoryThresholdNotifier function is called (Alt+F7 in GoLand while the cursor is on the function’s name) which is here https://github.com/kubernetes/kubernetes/blob/v1.23.1/pkg/kubelet/eviction/eviction_manager.go#L184 inside the Start method. Searching for who writes to the m.config.PodCgroupRoot (Alt+F7 in GoLand) yields just one result – this line https://github.com/kubernetes/kubernetes/blob/v1.23.1/pkg/kubelet/kubelet.go#L463 inside the NewMainKubelet function. Searching for the implementation of the GetCgroupRoot() function there leads to the most promising one here https://github.com/kubernetes/kubernetes/blob/v1.23.1/pkg/kubelet/cm/container_manager_linux.go#L586 whose comment states “// GetPodCgroupRoot returns the literal cgroupfs value for the cgroup containing all pods“. Searching for who writes to the cm.cgroupRoot variable there (again Alt+F7 in GoLand) leads us in the same file here https://github.com/kubernetes/kubernetes/blob/v1.23.1/pkg/kubelet/cm/container_manager_linux.go#L301 inside the NewContainerManager function. That cgroupRoot variable gets assigned to on this line https://github.com/kubernetes/kubernetes/blob/v1.23.1/pkg/kubelet/cm/container_manager_linux.go#L284 based on the defaultNodeAllocatableCgroupName string, which has a value of “kubepods” as seen in https://github.com/kubernetes/kubernetes/blob/v1.23.1/pkg/kubelet/cm/node_container_manager_linux.go#L40.
Coming back to the lines from where we started https://github.com/kubernetes/kubernetes/blob/v1.23.1/pkg/kubelet/eviction/memory_threshold_notifier.go#L52-L63, the end result does make sense: if the threshold parameter was the “allocatable” one, then the cgroup will be one containing all the pods (sys/fs/cgroup/memory/kubepods). Otherwise the threshold must be the hard eviction one, in which case the cgroupRoot variable is ignored and the resulting cgroup path will be the root one (sys/fs/cgroup/memory).
So, to recap: if it’s the allocatable cgroup being monitored then the “kubepods” cgroup will be chosen, otherwise the root one is used to see the overall node usage. The cgroup corresponds to the respective threshold: either the pod allocatable one (when the overall pod memory usage grows above “node allocatable” value) or the eviction hard threshold (when available node memory drops below the --eviction-hard value).
At this point you might be tempted to think that the thresholds are set against the memory usage metric for the 2 cgroups involved. But there’s more.
In https://github.com/kubernetes/kubernetes/blob/v1.23.1/pkg/kubelet/eviction/memory_threshold_notifier.go#L92-L93 we see the memory usage value that Kubelet compares it against: the capacity minus the hard eviction threshold plus inactive_file. If one deducts inactive_file from both sides of this equation – and knowing that the working set is the memory usage minus inactive_file as per the metrics table (see the table for cAdvisor), we can see that the goal is actually for the working set bytes to be compared against the capacity minus the hard eviction threshold.
But which capacity are we talking about? Is that the node’s capacity? The clever thing is that the code path for setting the threshold notification is common for both the allocatable cgroup as well as for the root cgroup, and the lines here https://github.com/kubernetes/kubernetes/blob/v1.23.1/pkg/kubelet/eviction/memory_threshold_notifier.go#L81-L88 dictate which cgroup is processed when the respective method is run.
So we get 2 notifications set: one for when the allocatable cgroup (“kubepods”) working set size crosses its capacity (which is total node capacity minus the --kube-reserved value) minus the hard eviction threshold, and the second for when the root cgroup (capturing everything running on the node) working set size crosses its capacity (which is the node capacity) minus the hard eviction threshold.
How are those metric values obtained by the Kubelet? Luckily the movies for 2 of the scenarios we’ve analyzed (OOM Scenario #2: Pods’ memory usage exceeds node’s “allocatable” value and OOM Scenario #3: Node available memory drops below the –eviction-hard flag value) contain the hint we need. In the movies, notice that every time the Kubelet reports the memory available both for pods allocatable as well as for the node, we get a reference to the specific line in the code that prints it. We can easily find that code here https://github.com/kubernetes/kubernetes/blob/v1.21.2/pkg/kubelet/eviction/helpers.go#L774. There are 2 methods that call it, but since the prefix is “observations“, that means it’s the synchronize method https://github.com/kubernetes/kubernetes/blob/v1.21.2/pkg/kubelet/eviction/eviction_manager.go#L229 that calls the function that prints the statistics. And in the synchronize method we can see https://github.com/kubernetes/kubernetes/blob/v1.21.2/pkg/kubelet/eviction/eviction_manager.go#L253 it’s data from the Summary API that’s used as input for the printed statistics.
Q&A
Q&A: Metrics components
Q: How can I see that kubectl top pod talks to the Metrics Server to retrieve its values?
A: Running kubectl top pod will invoke the getMetricsFromMetricsAPI function https://github.com/kubernetes/kubernetes/blob/v1.21.2/staging/src/k8s.io/kubectl/pkg/cmd/top/top_pod.go#L185, which uses the metrics API client code (the implementation of MetricsV1beta1 is in Kubernetes repo currently at staging/src/k8s.io/metrics/pkg/client/clientset/versioned/clientset.go) to talk to the Metrics Server. Alternatively, a quick way to see the API endpoint used is to append --v=9 to the kubectl top pod command as shown here https://stackoverflow.com/questions/68497673/kubernetes-rest-api-node-cpu-and-ram-usage-in-percentage, which reveals that the apis/metrics.k8s.io/v1beta1 is the API that processes the request, none other than the Resource Metrics API (it can’t be the Custom Metrics API, as that one has a different URL – either custom.metrics.k8s.io or external.metrics.k8s.io as per https://kubernetes.io/docs/tasks/debug-application-cluster/resource-usage-monitoring/).
Q: What can I use to get metrics directly from the container runtime, similar to how the Kubelet does on its /metrics/resource endpoint?
A: crictl stats can be used to talk directly over RPC to the container runtime to retrieve the metrics, (parameter list is here https://kubernetes.io/docs/tasks/debug-application-cluster/crictl/). The only catch with this CLI command is that the container id needs to be provided, but that’s easily obtainable from kubectl describe pod (take care that crictl runs against the local node, so choose a container whose parent pod is hosted on that particular node). The pod id can also be supplied but that’s not being written in the kubectl describe pod output currently.
Q: Does cAdvisor talk to the container runtime to retrieve its memory metrics? Or it simply collects cgroups info from the underlying node?
A: cAdvisor gets its metrics from the cgroup pseudo-files directly. See How does cAdvisor get its memory metric data?
Q: Does cAdvisor run on Windows?
A: No, as there is work needed as per https://github.com/google/cadvisor/issues/2170 to make this happen. One interesting way to see this is from the code itself. Just open it using an IDE (e.g GoLand or Visual Studio Code) on a Windows machine and notice how several types can’t be resolved. Changing the OS settings in the IDE to “Linux” makes the problem go away. Have a look here for more details https://youtrack.jetbrains.com/issue/GO-12022. Details on how to set the build constraints are here https://www.jetbrains.com/help/idea/configuring-build-constraints-and-vendoring.html#build-constraints
Q: What is the purpose of the “proxy” particle in URLs such as /api/v1/nodes/<node-name>/proxy/... when querying Kubelet endpoints directly via kubectl get --raw?
A: The Kubelet endpoints on our AKS cluster aren’t by default directly accessible from the Internet, so we need a way to be “dropped” right in “front” of the node whose Kubelet we’d like to query. The purpose of the /proxy path is to use the apiserver proxy https://kubernetes.io/docs/tasks/access-application-cluster/access-cluster/#so-many-proxies to get us directly to that node. See more details here https://stackoverflow.com/questions/69200128/what-is-node-proxy-subresource-in-kubernetes.
Q: How can I scale kube-state-metrics (KSM)? How about the Metrics Server?
A: For a not-so-big cluster, you probably don’t want multiple instances of either: kube-state-metrics doesn’t really support running multiple instances https://github.com/kubernetes/kube-state-metrics/issues/611 and on the other hand you won’t get any advantage by running 2 instances of the Metrics Server as stated here https://github.com/kubernetes-sigs/metrics-server/blob/master/FAQ.md#can-i-run-two-instances-of-metrics-server. From a performance standpoint, the Metrics Server is to be scaled vertically as explained here https://github.com/kubernetes-sigs/metrics-server/blob/master/FAQ.md#how-to-autoscale-metrics-server. On the 2-node Kubernetes test cluster used throughout this article – with 7-GiB of memory per node – the memory limit for the “metrics-server” container of the sole pod for Metrics Server was set automatically by AKS at 2000 MiB, while the request memory value was a meager 55 MiB.
However, if you’re running a cluster with a big number of nodes, then the approach that Datadog describes here https://www.datadoghq.com/blog/engineering/our-journey-taking-kubernetes-state-metrics-to-the-next-level/#how-does-the-ksm-check-scale – whereby they use multiple KSM deployments, but each targets specific resources – would be a way to go.
One important point is that having at least 2 replicas for the Metrics Server makes sense from the point of high availability, as this is the component used by default for Kubernetes to get its autoscaling “numbers”, as explained here https://kubernetes.io/docs/tasks/run-application/horizontal-pod-autoscale/#how-does-a-horizontalpodautoscaler-work. As such, having the only installed instance of Metrics Server down for some time would obviously impact autoscaling. A manifest that deploys the Metrics Server in HA mode is provided here along with instructions: https://github.com/kubernetes-sigs/metrics-server#high-availability.
Q: I’d like to understand more about the topic of Kubernetes monitoring, but I don’t really get this post. Are there other, better articles that explain this?
A: Have a look at this very well-written article that goes into higher-level concepts around monitoring but also delves deep into how things are working under the hood https://blog.freshtracks.io/a-deep-dive-into-kubernetes-metrics-b190cc97f0f6.
Q: This article https://kubernetes.io/docs/tasks/debug-application-cluster/resource-metrics-pipeline/#metrics-server states at this time (Dec 2021) that “the Metrics Server uses the Summary API to collect metrics“. Is this correct?
A: It is correct indirectly. The Metrics Server no longer contacts the Summary API directly, but through the Resource Metrics endpoint on the Kubelet, as this commit https://github.com/kubernetes-sigs/metrics-server/pull/787/commits/c1136a8df9837da9f57e9ebafe8ca393dcec73ff#diff-6e5b914d1403a14af1cc43582a2c9af727113037a3c6a77d8729aaefba084fb5L110-R88 shows; inside this commit for the Metrics Server notice that the /stats/summary endpoint is being replaced with /resource/metrics when targeting the Kubelet. However, the Resource Metrics endpoint uses the Summary API to get its statistics as shown here: How can I see that the Resource Metrics endpoint gets its data from the Summary API?
Q: Does Kubernetes API Server forward the /metrics endpoint to the Metrics Server, or it serves it locally?
A: Looking at the metrics returned by the Kubernetes API Server, they are different from all the other metrics returned by the various endpoints; there is a process_resident_memory_bytes metrics shown in both Kubernetes API server and the Kubelet’s own metrics, but the values are different, with most likely one referring to the kube API process running on the control plane inside AKS (and off-limits to us as users https://docs.microsoft.com/en-us/azure/aks/concepts-clusters-workloads#control-plane) and the other to the Kubelet process running on the node queried (Kubelet’s own metrics endpoint). So the answer is probably no: the request for /metrics doesn’t get forwarded to the Metrics Server.
Q: On the metrics components diagram the Resource Metrics API endpoint is shown obtaining its data from the Summary API endpoint. Is there some sort of redirection from /metrics/resource to /stats/summary?
A: No, there is no redirection. The Resource Metrics API endpoint simply calls code inside the Summary API that retrieves the metrics it’s after.
Q&A: Tools for viewing metrics
Q: What do the colons represent in some Prometheus metric names? E.g. cluster:namespace:pod_memory:active:kube_pod_container_resource_requests.
A: They’re introduced as part of recording rules (just as the docs say https://prometheus.io/docs/concepts/data_model/#metric-names-and-labels), which as defined here https://prometheus.io/docs/prometheus/latest/configuration/recording_rules/#recording-rules “allow you to precompute frequently needed or computationally expensive expressions and save their result as a new set of time series“. All these new time series are defined in .yaml files inside the Helm chart that deploys Prometheus and Grafana. For cluster:namespace:pod_memory:active:kube_pod_container_resource_requests, this is defined in the kube-prometheus-stack\templates\prometheus\rules-1.14\k8s.rules.yaml file.
Q: What’s the advantage of using Grafana over Prometheus’ own UI to display query results?
A: From my experiments, Grafana can display PromQL queries for the metrics themselves even nicer than Prometheus’ own UI, as it shows the target and metrics path in a separate column.
Q&A: Metrics values
Q: There’s a process_resident_memory_bytes metric that I’m seeing in Prometheus. Can’t I use this one to return information about my application?
A: Unless your application process(es) are written in Go, there won’t be anything returned. You can do a quick check to confirm: in Grafana’s Explore blade, type the metric name and just hit “Run query”. Inside the table that is displayed look for the containers that return data for that metric (avoid Prometheus/Grafana containers as those are running Go processes).
Q&A: Adventures in Code
Q: Can I just setup the Go IDE under Linux and run tests from there?
A: I did try that based on this excellent article https://medium.com/@japheth.yates/the-complete-wsl2-gui-setup-2582828f4577. But even though apps such as Firefox displayed just fine on Windows after the configuration was complete, I couldn’t get JetBrains Toolbox to work (a white rectangle would be displayed), so I gave up trying to deploy GoLand particularly since I discovered it has WSL2 support on Windows.
